TradeStation Web Trading
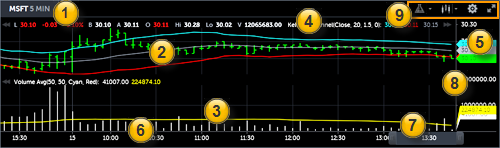
The Chart View appears in the lower portion of the Web Trading window. The Chart displays a price chart for the specified symbol and interval using a chosen chart style along with any selected indicators
The following outlines the general steps you will follow when using the Chart View.
 Symbol/Interval
View and change the chart symbol and chart interval here. Highlight the text field and then type the symbol and/or the interval. Typing just the symbol leaves the interval as set. Changing the interval alone leaves the symbol as set.
 Price Chart
 Graphically shows how a particular symbol is performing over time. One or more indicators may overlay the price data as shown.
 Subgraph
 Displays indicators that plot using their own price scale. Indicators are preset to appear as an overlay in the price chart or in a subgraph.
 Status Line

The Status Line appears at the top of a price chart or subgraph. It displays information about a symbol and any indicators applied to the chart or subgraph.
 Current Price Indicators
Displays the current price for Price Chart and current data for any indicators.
 Timeline
The Timeline appears as the horizontal axis and is the displayed period of time from within the downloaded underlying price history data (set in Chart Configuration > Lookback). The Price Chart and Subgraph reference the same Timeline.
 Chart Scroll/Zoom
The Chart Scroll/Zoom control is used to expand or compress the period displayed from the underlying price history data (set in Chart Configuration > Lookback). Widening the control expands the amount of downloaded price history displayed. Narrowing the control reduces (or focuses in on) the time period displayed. Both left- and right-sides of the control are movable. The right-side is set at "now" by default but may be moved left to have the displayed time period end at some point in the past.
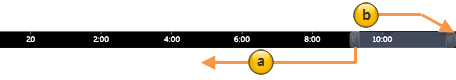
(a) The left-side of the Chart Scroll/Zoom can be moved left to display more of the underlying price history data or right to narrow it.
(b) The right-side of the Chart Scroll/Zoom control determines the ending point of the displayed underlying price history data. When set to the far right, as shown, the end point is the current time.
The Chart Scroll/Zoom works within the downloaded price history data that has been set in the Chart Configuration above.
 Vertical Axis
The vertical axis is the price axis in the appropriate currency. A subgraph will have its own scale.
 Chart Settings
The Chart Settings buttons let you add indicators, select your desired bar type, and set the period for price history download.
Click the Manage Indicators to add or remove indicators.
Click the Bar Type button to select the desired bar type.
Click the Configuration button and use the Chart Configuration dialog to change the interval and price history settings.