 lets you choose between an OHLC, Candlestick, Line, and Area bar display in the pull-down.
TradeStation Web Trading
The Chart Display Type button lets you choose between an OHLC, Candlestick, Line, and Area bar display in the pull-down.
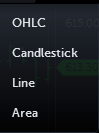
OHLC - Displays the open, high, low, and close for each bar (this is the default option). For example, in a chart with a daily data interval, each bar shows the open, high, low, and close for that day's session.
Candlestick - Uses the same price data as a bar chart, with each candlestick representing the open, high, low and closing price. The "thick" part of the candlestick is known as the "real body" and represents the range between the open and closing prices. The thin line above the body represents the high, and the thin line below the body represents the low.
Line - Displays a line that connects all the closing prices over the data interval period.
Area - Displays a line-on-close chart with the area below the line filled.