OptionStation Pro
Vega measures the expected change in the price of an option due to a 1-percentage point increase or decrease in the volatility that is used to calculate theoretical values. As we discussed earlier, volatility is a measure of the amount by which an underlying asset is expected to fluctuate over a given period of time.
The volatility of the underlying asset has a major influence on the price of an option. Knowing the volatility characteristics of an underlying asset, along with how the volatility is expected to change the option’s price, is a valuable risk-management tool for evaluating options trading strategies.
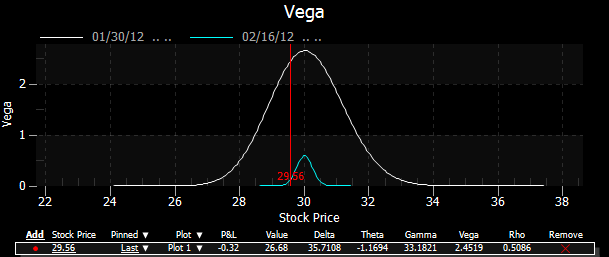
In OptionStation Pro, the Vega graph plots one or more curves of specified expiration dates with the underlying price on the X-axis and the position Vega value on the Y-axis. For a stock option, the position Vega would be the option Vega multiplied by size of the underlying position (i.e. x100 shares per contract for stocks).
The following graph shows the position Vega for a single Call at a strike price of 30 for Feb expiration. The vertical red line is the price point of the last traded stock price.