
OptionStation Pro
At the bottom of the 2D Graph you will find an area where different Price Points can be defined for real-time analyzing and monitoring. This is very helpful in determining what a profit or loss might be if the underlying asset price were to change 5% or 10% higher or lower for any plotted expiration. You can also see how the Greeks will behave with changes in the underlying stock.
Add – Clicking Add creates a new individual price point row using Last for the Stock Price (by default). You can create up to 7 Price Point rows.
Color Dots – Please note that the color dots show the color of the price point lines in the Spread Profile.
Stock Price – By default, this value is “pinned” to the Last price of the underlying asset. Clicking on this number will enable you to modify price by either using the scroll bar or typing over the current price shown. If the price is modified, it will be fixed to that value and not change with the market. To “pin” the price back to a live value, you can click on the colored dot to the left of the price and choose Pin to Last or one of the provided offsets.
Pinned – Displays what price attribute the Stock Price is “pinned” to, if any. If the Stock Price is not pinned, this field will be blank. Clicking the arrow to the right of Pinned lets you automatically create multiple price points for combinations of percentage or standard deviation offsets above/below the Last. Clicking the arrow to right of an individual price point row lets you change the specific pinned offset for that row.
Plot - Indicates the number of the Plot for which you want to display price point values. The color of the plot number will be the same as the referenced plot line. The number of plots is specified on the Settings panel.
Remove – Deletes a price point row by clicking on the X to the right.
P&L – Displays the current profit/loss of the selected Plot in dollars.
Value – Displays the current value of the selected Plot in dollars.
Greeks – Displays the Delta, Theta, Gamma, Vega, and Rho values of the selected Plot number.
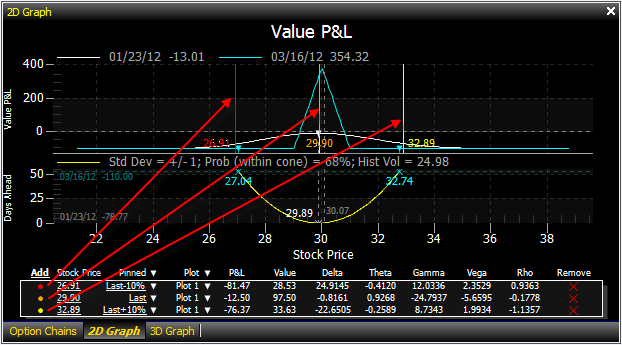
You are able to reposition the Price Point bars by directly dragging them to the left or right on the graph. Any movement made to the bars will change the corresponding values in their respective price point rows.