OptionStation Pro
In OptionStation Pro, the Value P&L risk graph plots the total profit and loss value of selected options and spreads. The underlying price is on the X-axis and the Value P&L of the option position is on the Y-axis. The graph plots the selected theoretical or real values of positions that are available in OptionStation Pro. There is a maximum of four plots per graph.
An option is considered a wasting asset, and as the expiration date, or dates, of the options comprising your position move closer to expiration, the value of the option and the position decreases. Before the option contract expires you will either close your position by selling (or buying back) the option, buying or selling the underlying asset, or allowing the contract to expire worthless. Options strategies are designed to take advantage of the elements that affect the value of an option by limiting risk and optimizing reward. They are used to manage risk and protect your overall positions. Position risk graphs help you to assess the impact of these factors.
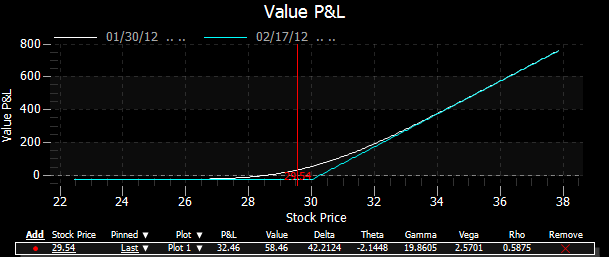
In the example below, the vertical Y-axis of the graph represents the position value of the specified option or spreads being charted, and the horizontal X-axis represents the Underlying Asset Price range (as it increases and decreases). In this example, the graph shows the Value P&L for a single Call at a strike price of 30 for Feb expiration. The vertical red line is the price point of the last traded stock price.