OptionStation Pro
Theta measures the amount an option’s price will decline due to the passage of one full calendar day (time value). Time is a depreciating asset, and so Theta is expressed as a negative value and can be measured for one option or for an entire options position. The Theta value is not linear; options lose time value at a faster rate as expiration approaches. The farther away from expiration an option is, the smaller the effect of Theta. At expiration, the option’s time value drops to zero and what is left is the option’s intrinsic value, if any.
Theta provides traders with a method to determine how time value will erode their position today and in the future until expiration.
In OptionStation Pro, the Theta graph plots one or more curves of specified expiration dates with the underlying price on the X-axis and the position Theta value on the Y-axis. For a stock option, the position Theta would be the option Theta multiplied by size of the underlying position (i.e. x100 shares per contract for stocks).
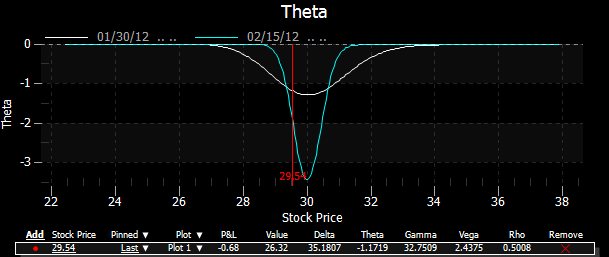
The following graph shows the position Theta for a single Call at a strike price of 30 for Feb expiration. The vertical red line is the price point of the last traded stock price.