OptionStation Pro
Rho measures the expected change in the price of an option due to a 1-percent change in the risk-free interest rate for the period of the option contract. Although Rho is not commonly used or referred to in most options trading materials, it still offers valuable information regarding the relationship between an options position and the risk-free interest rate money could earn.
Generally, the risk-free interest rate used for calculating theoretical options prices is the current 90-day Treasury bill rate. Longer-term options contracts use longer-term notes: 1-year or 2-year note rates are often used in the pricing model for LEAPS. High interest rates result in slightly higher options premiums; lower interest rates suggest lower premiums. Rho is an efficient way to measure exposure to interest rates over the period of the option’s contract.
![]() Interest rate can be adjusted
using the Settings panel in OptionStation Pro.
Interest rate can be adjusted
using the Settings panel in OptionStation Pro.
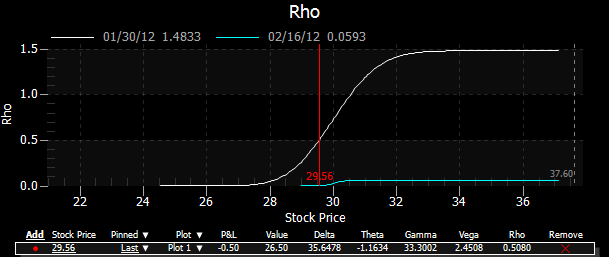
In OptionStation Pro, the Rho graph plots one or more curves of specified expiration dates with the underlying price on the X-axis and the position Rho value on the Y-axis. For a stock option, the position Rho would be the option Rho multiplied by size of the underlying position (i.e. x100 shares per contract for stocks).
The following graph shows the position Rho for a single Call at a strike price of 30 for Feb expiration. The vertical red line is the price point of the last traded stock price.