OptionStation Pro
Gamma measures the expected change in an option’s delta for every 1-point change in the price of the underlying asset. This is used to estimate the delta values as the asset price moves.
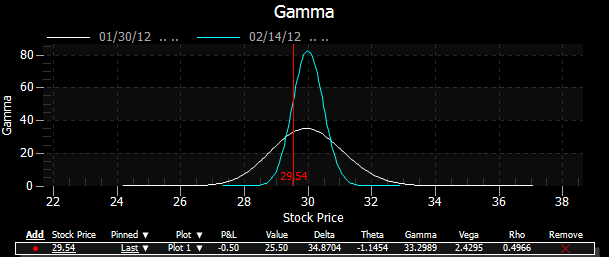
In OptionStation Pro, the Gamma graph plots one or more curves of specified expiration dates with the underlying price on the X-axis and the position Gamma value on the Y-axis. For a stock option, the position Gamma would be the option Gamma multiplied by size of the underlying position (i.e. x100 shares per contract for stocks).
The following graph shows the position Gamma for a single Call at a strike price of 30 for Feb expiration. The vertical red line is the price point of the last traded stock price.