OptionStation Pro
Delta is the amount by which an option’s price is expected to change for each 1-point change in the underlying asset price. That is, option prices move only in some proportion to the asset price, expressed as the delta.
Delta ranges from 0 to +1 for a Call and 0 to -1 for a Put. This means that the maximum delta for a Call option is +1, and for a Put option is -1. The more In-the-Money a Call option is, the closer to +1 the delta becomes; the more In-the-Money a Put option is, the closer to -1 the delta becomes; and the more Out-of-the-Money an option is (Call or Put) the closer to 0 the delta becomes.
An At-the-Money Call option typically has a delta of .5, which means if the asset goes up one dollar, the option will increase in value by $.50.
A Long Call position has a positive delta, and a Long Put position has a negative delta. The positive or negative sign indicates whether the delta represents a value positively or negatively correlated with the asset price movement.
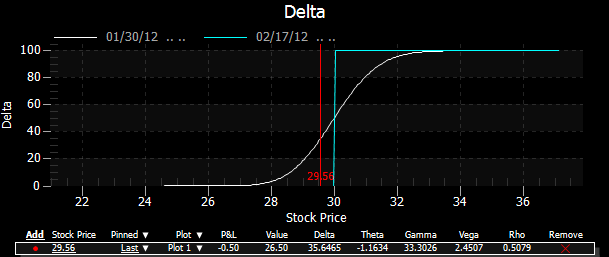
In OptionStation Pro, the Delta graph plots one or more curves of specified expiration dates with the underlying price on the X-axis and the position Delta value on the Y-axis. For a stock option, the position Delta would be the option Delta multiplied by size of the underlying position (i.e. x100 shares per contract for stocks).
The following graph shows the position Delta for a single Call at a strike price of 30 for Feb expiration. The vertical red line is the price point of the last traded stock price.