Filter Bar in RadarScreen
The RadarScreen Filter Bar allows you to specify which symbols display in a RadarScreen window based on a combination of the characters in a symbol, the filter value or range within a study column, and the symbol asset category. You can apply up to five levels of filter expressions on each page in a RadarScreen window to narrow down your display to a set of symbols that meet your defined criteria.
![]() Toggle items on or off using the RadarScreen Settings > Symbol Search, Settings > Filter Bar, Settings > Asset Bar menu sequence.
Toggle items on or off using the RadarScreen Settings > Symbol Search, Settings > Filter Bar, Settings > Asset Bar menu sequence.
Layout

The combination of values entered in the filter bar symbol, filter, and asset sections will determine which symbols will be displayed. To display all symbols after using your own filter criteria, clear the symbol box, set the filter expression to None, and select the All category.
 Filter
Filters can be used to determine which symbols will display on the associated RadarScreen page based on the defined filter expression rows. A filter expression consists of a specified study column (first box), a comparison operator (second box), and a comparison value (third box).

Multiple filter expressions (up to five) can be combined to create complex filtering, such as different columns and comparisons. Clicking the + box to the right of a filter row adds a new expression directly below it, not at the end of the list. This allows you to add expressions in any position. Clicking the - box to the right of a filter row removes it.
A check mark in the box to the right of each filter row indicates whether it is active or not. This allows you to define filter expressions and selectively activate or deactivate them without removing expressions from the list. Each of the active filter expressions are applied using an AND operator (on the left side of the expression group) or an OR operator. The combination of the active filter expressions and their operators will determine the symbols that are displayed.
The D and T boxes allow you to enter a date or time value in the comparison box. Study columns like Trade Date or Dividends|NextQtr Ex (ex-dividend date) accept a date value. A study column like Trade Time accepts a time value.
In addition, the background color of each column being used in a filter expression becomes grey to indicate that it is part of an active filter.
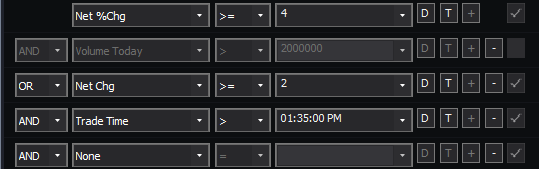
In the example above, the first row is set to filter for symbols that have a Net %Chg value greater than or equal to 4% using the following expression elements: Net %Chg (study column); >= (comparison operator); 4 (4%) (comparison value). The second row is set to filter for symbols that have a Trade Volume of greater than 2,000,000 shares, but it has been marked not active. The third row uses an OR condition to filter for symbols that have a Net Chg value greater than or equal to 2 (2 points, not 2 percent). The fourth row is set to filter for any trade time greater that 1:35 PM. The fifth row has been newly added and does not contain any filter expression. Since the first, third, and fourth rows are the only active defined filters, this combination results in the display of symbols with a Net %Chg greater than or equal to 4% OR a Net Chg value greater than or equal to 2, either of which have traded after 1:35 PM.
 Symbol
Displays all symbols that contain the character(s) entered in the Symbol box within the symbol name or the underlying symbol description. For example, when filtering the Dow Jones Industrial Average symbol list, the characters "ms" will display both CSCO and MSFT because the description for Cisco Systems and the MSFT symbol name both contain the specified characters.
 Asset
Asset
Displays all symbols where the selected asset matches the symbol type. You can specify All symbol types, Stocks, Futures, or Options.