 Tops and Bottoms (ShowMe)
Input Information
| Name |
Expression |
Default |
Description |
|
TopBottomOrBoth |
3 |
Controls which patterns are identified. Enter 1 to identify top patterns only, enter 2 to identify bottom patterns only, or enter 3 to identify both top and bottom patterns. |
|
|
NumberOfTops |
Numeric |
3 |
Number of tops required for top patterns. For example, to identify a triple top, enter 3. |
|
NumberOfBottoms |
Numeric |
3 |
Number of bottoms required for bottom patterns. For example, to identify a triple bottom, enter 3. |
|
TopPatternSwingHighStrength |
Numeric |
3 |
The number of bars used to confirm high pivot values for top patterns. This value will be used for both the left strength and right strength of the pivot. |
|
TopPatternSwingLowStrength |
Numeric |
3 |
The number of bars used to confirm low pivot values for top patterns. This value will be used for both the left strength and right strength of the pivot. |
|
BottomPatternSwingHighStrength |
Numeric |
3 |
The number of bars used to confirm high pivot values for bottom patterns. This value will be used for both the left strength and right strength of the pivot. |
|
BottomPatternSwingLowStrength |
Numeric |
3 |
The number of bars used to confirm low pivot values for bottom patterns. This value will be used for both the left strength and right strength of the pivot. |
|
NumATRsForTopPattern |
Numeric |
1 |
The number of ATRs to be used to determine if the pivot highs for a top pattern are close enough in price to each other for the pattern. |
|
NumATRsForBottomPattern |
Numeric |
1 |
The number of ATRs to be used to determine if the pivot lows for a bottom pattern are close enough in price to each other for the pattern. |
|
NumATRsforProfitZoneHeight |
Numeric |
1 |
The number of ATRs to be used to determine the 'height' of the profit zone rectangle. |
|
ATRLength |
Numeric |
14 |
The number of bars to use in the moving average of true range. |
|
MaxDurationBars |
Numeric |
30 |
The maximum number of bars that trendlines (after pattern is confirmed) or profit zone rectangles are drawn. |
|
ShowTopPatternLabels |
Numeric |
1 |
Used to control whether or not labels are used to identify top patterns. Enter 1 to draw text labels that identify the pivots that make up the top pattern. Enter 0 to not draw the text labels. |
|
ShowBottomPatternLabels |
Numeric |
1 |
Used to control whether or not labels are used to identify bottom patterns. Enter 1 to draw text labels that identify the pivots that make up the bottom pattern. Enter 0 to not draw the text labels. |
|
ShowTopPatternTrendline |
Numeric |
1 |
Used to control whether or not support trendlines are drawn for top patterns. Enter 1 to draw a trendline for top patterns. Enter 0 to not draw the trendline. |
|
ShowBottomPatternTrendline |
Numeric |
1 |
Used to control whether or not resistance trendlines are drawn for bottom patterns. Enter 1 to draw a trendline for bottom patterns. Enter 0 to not draw the trendline. |
|
DrawTopPatternProfitZoneRectangle |
Numeric |
1 |
Used to control whether or not profit zone rectangles are drawn for top patterns. Enter 1 to draw a profit zone rectangle for top patterns. Enter 0 to not draw the rectangle. |
|
DrawBottomPatternProfitZoneRectangle |
Numeric |
1 |
Used to control whether or not profit zone rectangles are drawn for bottom patterns. Enter 1 to draw a profit zone rectangle for bottom patterns. Enter 0 to not draw the rectangle. |
|
TopString |
T |
The string to be used in the text label to identify high pivots that make up a top pattern. |
|
|
BottomString |
String |
B |
The string to be use in the text label to identify low pivots that make up a bottom pattern. |
|
TopPatternColor |
Numeric |
Magenta |
The color to be used for identifying top patterns. |
|
BottomPatternColor |
Numeric |
Cyan |
The color to be used for identifying bottom patterns. |
|
ProfitZoneFillColorTransparency |
Numeric |
75 |
The desired percentage transparency of the profit zone rectangle fill color. The value should be between 0 and 100. |
|
PlotOffsetTicks |
Numeric |
1 |
The number of price ticks to offset the plot from the bar high (bottom pattern) or low (top pattern). |
|
TextLabelFontSize |
Numeric |
8 |
The font size for the text labels. |
Description
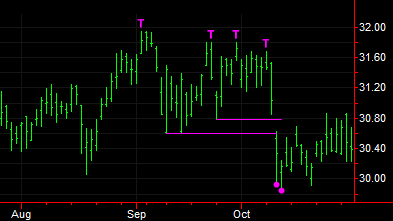
This study identifies top and bottom patterns (e.g., double top, triple bottom, etc.) based on the input settings described above. Top and bottom patterns are sometimes used for identifying potential price reversals.
If a pattern is confirmed, the code uses text labels to identify the pivot high values (for a top pattern) or the pivot low values (for a bottom pattern) that make up the top or bottom pattern.
The code draws a trendline for the pattern, which is a horizontal line, that originates at the lowest pivot low making up a top pattern or the highest pivot high making up a bottom pattern. The trendline is truncated if a) Closing price crosses under the trendline (top pattern) or if the Closing price crosses over the trendline (bottom pattern), or b) the pattern is invalidated (Close crosses over the highest pivot high making up a top pattern or Close crosses under the lowest pivot low making up a bottom pattern), or c) the trendline has been drawn for the ‘MaxDurationBars’ number of bars.
If the trendline is truncated due to price piercing the trendline, a ShowMe dot is plotted and a profit zone rectangle is drawn. The profit zone rectangle height is determined by the 'NumATRsforProfitZoneHeight' input value times the Average True Range value at the time the rectangle is drawn.
If price touches or penetrates the top of the profit zone (for bottom pattern) or if price touches or penetrates the bottom of the profit zone (for top pattern), the profit zone rectangle is truncated. The profit zone rectangle is also truncated after it has been drawn for the number of bars set in the ‘MaxDurationBars’ input.
This study works in Charting only.
![]() This ShowMe study contains alert criteria; when you enable the alert, an alert is triggered 1) when a top pattern is confirmed, 2) when a bottom pattern is confirmed, 3) when the support trendline (for top pattern) is broken to downside, 4) when the resistance trendline (for bottom pattern) is broken to upside, 5) when the profit zone is exceeded for a top pattern, and 6) when the profit zone is exceeded for a bottom pattern.
This ShowMe study contains alert criteria; when you enable the alert, an alert is triggered 1) when a top pattern is confirmed, 2) when a bottom pattern is confirmed, 3) when the support trendline (for top pattern) is broken to downside, 4) when the resistance trendline (for bottom pattern) is broken to upside, 5) when the profit zone is exceeded for a top pattern, and 6) when the profit zone is exceeded for a bottom pattern.
Related Functions
SwingHighBar, SwingLowBar, AvgTrueRange
Related Classes
Exception Classes,TextLabel Class,TrendLine Class, Dictionary Class