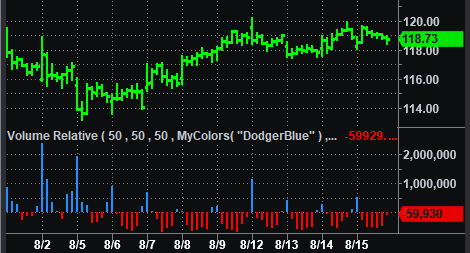
 Volume Relative (Indicator)

Input Information
| Name | Expression | Default | Description |
| AvgLength | Numeric | 50 | The length, in bars, of the moving average of volume to which each bar's volume is compared (above average or below average). |
| AlertPctAbove | Numeric | 50 | The percentage amount above the average at which to trigger an alert. (The indicator must be customized to enable the alert after the indicator has been applied.) |
| AlertPctBelow | Numeric | 50 | The percentage amount below the average at which to trigger an alert. (The indicator must be customized to enable the alert after the indicator has been applied.) |
| AboveAvgColor | Numeric | MyColors( "DodgerBlue" ) | Enter the color to be used for the volume plot when volume is above the average volume. |
| BelowAvgColor | Numeric | Red | Enter the color to be used for the volume plot when volume is below the average volume. |
| EqualAvgColor | Numeric | DarkGray | Enter the color to be used for the volume plot when volume is equal to the average volume. |
Market Synopsis
Plots the amount by which the volume of each bar exceeds or falls short of the average volume. The average volume is calculated over a user-specified number of bars. Plot coloring is controlled by inputs (see above).
Plot Information
| Number | Name | Default Color | Description |
| Plot1 | RelVol | Dodger blue for volume that is above average, red for volume that is below average, dark gray for volume that is equal to the average. | Plots the relative volume as a histogram. |
| Plot2 | ZeroLine | Transparent | Plots a transparent zero line. |
This study can be applied to a RadarScreen window, or to a chart. It also can be used in the Scanner.