 F Score (Indicator)
Market Synopsis
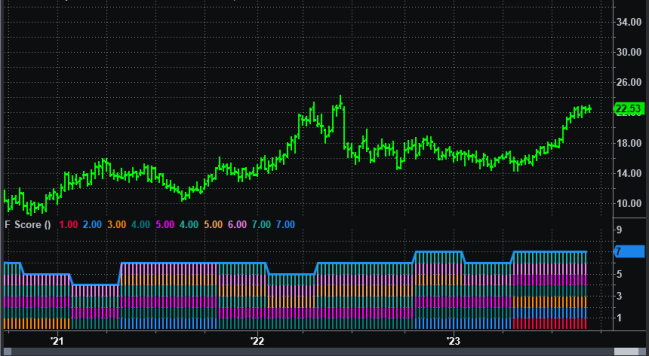
Plots the signal values and composite "F Score" described by Joseph D. Piotroski (citation below). The composite F Score is the sum of 9 accounting-based fundamental "signal" values, each of which is either 0 or 1 in a given accounting period (usually a calendar quarter). See the cited reference for a detailed description of the signal values and the composite score.
Plot Information
| Number | Name | Default Color | Description |
| Plot1 | ROA | Red | Plots the F_ROA signal value (0 or 1). |
| Plot2 | △ROA | Dodger Blue | Plots the F_△ROA signal value (0 or 1). |
| Plot3 | △Mrg | Dark Orange | Plots the F_△MARGIN signal value (0 or 1). |
| Plot4 | CFO | Teal | Plots the F_CFO signal value (0 or 1). |
| Plot5 | △Lqd | Magenta | Plots the F_△LIQUID signal value (0 or 1). |
| Plot6 | △Lvr | Light Sea Green | Plots the F_△LEVER signal value (0 or 1). |
| Plot7 | △Trn | Sandy Brown | Plots the F_△TURN signal value (0 or 1). |
| Plot8 | Acc | Violet | Plots the F_ACCRUAL signal value (0 or 1). |
| Plot9 | EqO | Light Sea Green | Plots the EQ_OFFER signal value (0 or 1). |
| Plot10 | FS | Dodger Blue | Plots the composite F_SCORE value, which can range in value from 0 to 9. |
| Plot11 | Zero | transparent | Plots a transparent zero line for scaling of the composiite F Score histogram. |
Remarks
See About Fundamental Data in TradeStation for more information about using fundamental data in your analysis.
Reference
Piotroski, J., “Value Investing: The Use of Historical Financial Statement Information to Separate Winners from Losers”, Journal of Accounting Research (38), 2000, 1-41.