 DMI Oscillator (Indicator)
Input Information
| Name | Expression | Default | Description |
| DMILength | Numeric | 10 | The number of bars over which to calculate the DMIPlus and DMIMinus values that are used to calculated the oscillator. |
| ShowMA | Numeric | 1 | Enter 1 to plot a moving average of the oscillator. Enter 0 if you do not wish to plot a moving average of the oscillator's value. |
| MALength |
Numeric |
10 | Number of bars used to calculate the moving average of the oscillator if ShowMA is 1. |
| OverSold |
Numeric |
-20 | Level at which to plot the oversold line. Note that this input, like all EasyLanguage inputs, can be set to any valid EasyLanguage expression, such as Lowest( DMIOsc(10), 30 ). |
| OverBought |
Numeric |
20 | Level at which to plot the overbought line. Note that this input, like all EasyLanguage inputs, can be set to any valid EasyLanguage expression, such as Highest( DMIOsc(10), 30 ). |
| AlertIfCrossUp |
Numeric |
1 | Enter 1 if it is desired for an alert to be generated when the oscillator's value crosses from below 0 to above 0. (Alerts must be enabled in the chart or RadarScreen window.) Enter 0 if no alert is to be generated when the 0 level is crossed from below. |
| AlertIfCrossDown |
Numeric |
1 | Enter 1 if it is desired for an alert to be generated when the oscillator's value crosses from above 0 to below 0. (Alerts must be enabled in the chart or RadarScreen window.) Enter 0 if no alert is to be generated when the 0 level is crossed from above. |
| DMI_Osc_Up_Color |
Numeric |
UpColorDefault |
The oscillator's plot color when the oscillator's value is greater than 0. |
| DMI_Osc_Down_Color |
Numeric |
DownColorDefault | The oscillator's plot color when the oscillator's value is less than or equal to 0. |
| BackgroundColorAlertCell |
Numeric |
DarkGray | Color to paint background of cell in RadarScreen when an alert occurs. (Alerts must be enabled in the RadarScreen window.) |
Market Synopsis
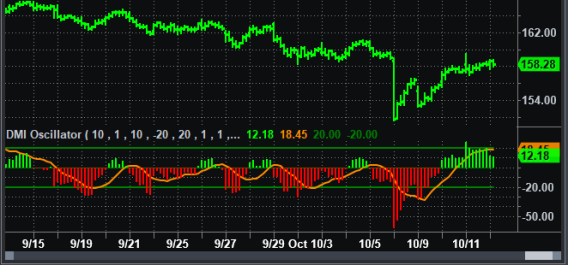
Plots the difference between the DMIPlus and DMIMinus values which J. Welles Wilder developed to detect directional movement in prices (see references, below).
Plot Information
| Number | Name | Default Color | Description |
| Plot1 | DMIOsc |
Green (above 0) or Red (at or below 0)
|
Plots the DMI oscillator's value. |
| Plot2 | DMIAvg | Dark Orange | Plots a simple moving average of the DMI oscillator's value. |
| Plot3 | OverBot | Dark Green | Plots the value specified by the OverBought input (see above). |
| Plot4 | OverSld | Dark Green | Plots the value specified by the OverSold input (see above). |
| Plot5 | ZeroLine | Dark Green | Plots a horizontal line at 0. |
| Plot6 | CrossBarsAgo | Default | Plots the number of bars ago at which the oscillator's value last crossed 0 (RadarScreen only). |
References
Star, Barbara. "The DMI Stochastic", Technical Analysis of Stocks and Commodities (31), January, 2013.
Wilder, J. Welles, Jr. New Concepts in Technical Trading Systems (Greensboro, NC: Trend Research, 1978).