TradeStation Walk-Forward Optimizer
When viewing the results of a Walk-Forward Analysis, the Sensitivity Analysis tab on the right side of the results tabs lets you study how an individual optimization parameter impacts the performance of your strategy.
Access from the TradeStation WFO by running a WFA and clicking the Sensitivity Analysis tab.
![]() Sensitivity Analysis may only be used with optimization data created
using the Exhaustive method in the TradeStation platform to ensure that
you have a complete set of data points for each possible input value.
Sensitivity Analysis may only be used with optimization data created
using the Exhaustive method in the TradeStation platform to ensure that
you have a complete set of data points for each possible input value.
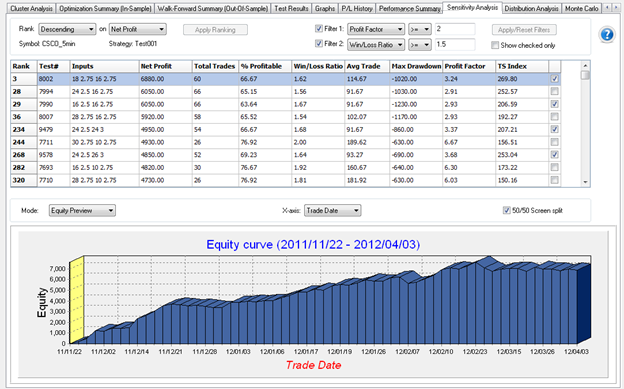
The top portion of the tab lets you specify the ranking criteria and filter settings to use for plotting a Sensitivity Curve or Equity Graph.

The ranked test results consists of a unique combination of parameters values from the range of inputs values and incremental changes that you selected when choosing the strategy inputs to optimize. The Test# column represents the same parameter combination as the Test column of the Performance Optimization Report.
The input parameter combination is selected from the table at the top of the tab where the first two columns are named Rank and Test#. The third Inputs column displays the input values for the specified combination in the order listed when selecting the inputs to optimize from the Strategies tab of the Format Analysis Techniques window in the TradeStation platform.
The Sensitivity Analysis tab provides you with two display modes. The first lets you view a Sensitivity Analysis chart and is only available with an exhaustive optimization. The second mode lets you view Equity curves for any individual test performed during either genetic optimization.
![]() Note that if you performed a genetic optimization, the mode and tab name are automatically set to Equity Preview.
Note that if you performed a genetic optimization, the mode and tab name are automatically set to Equity Preview.
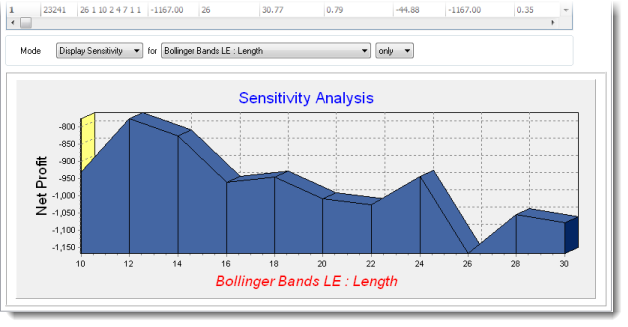
The following Mode settings are used to show a Sensitivity Analysis graph for the selected input parameter (see picture above).
![]() Sensitivity
Analysis may only be used with optimization data created using the Exhaustive
method in the TradeStation platform to ensure that you have a complete
set of data points for each possible input value.
Sensitivity
Analysis may only be used with optimization data created using the Exhaustive
method in the TradeStation platform to ensure that you have a complete
set of data points for each possible input value.
The Sensitivity Analysis graph allows you to view the incremental values for the specified single input on the x-axis against a fitness function on the y-axis. The drop-down list at the top of the graph lets you choose the desired set of test results and the input parameter you want to view on the x-axis of the graph.

Use the following Mode settings to show an Equity Curve (see picture below).
