TradeStation Walk-Forward Optimizer
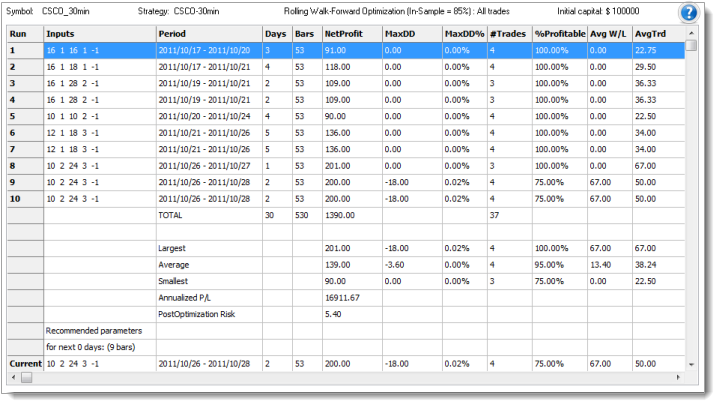
After a walk-forward optimization has been completed, the Optimization Summary (In-Sample) tab provides a summary of the in-sample window performances for the selected walk-forward analysis. This table also estimates the post-optimization trading risk, calculated as the average drawdown * 1.5.
Experience has shown that a model that generates a post optimization drawdown exceeding 150% of optimization drawdown, is showing signs of trouble.
