Analysis Techniques & Strategies
| Name | Expression | Default | Description |
| MinRStren | Numeric | 1 | Minimum right strength range value. |
| MaxRStren | Numeric | 300 | Maximum right strength range value. |
| LRFactor | Numeric | 1 | Multiplier used to calculate the left strength based on the right strength. |
| DrawLines | Boolean | True | Determines if a horizontal line is drawn from previous pivot lows to the current bar. |
| LinesColor | Numeric | Red | Color of horizontal marker lines. |
| PlotColor | Numeric | Yellow | Color of the ShowMe marker. |
| ColorScheme | Numeric | 1 | Determines what PlotColor input applies to in Charting and RadarScreen. Set to 0 for no coloring, 1 to color RS text or Chart marker, 2 to color RS cell background. |
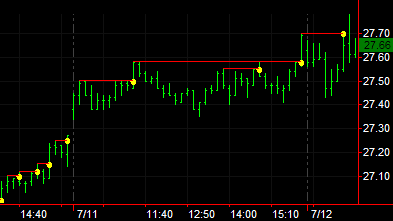
The Pivot Rev Gen - Up ShowMe study identifies when any price on the current bar breaches any previously un-breached "significant" high pivot. On a chart, it places a dot on the current bar at the identified high pivot price and optionally draws a horizontal line from the pivot high to the current bar. In RadarScreen, it inserts the pivot high price in the indicator cell. You can change the left and right strength values used to calculate the pivot.
Note In RadarScreen, if you want to process the equivalent of a 1000 bar "chart", you will need to load 1000 "additional bars" (the as-delivered default setting is 200).
A pivot is considered "significant" if it's right strength is within the range specified by the MinRStren and MaxRStren inputs, and it's left strength is greater than LRFactor times it's right strength. If LRFactor is set to 0, the pivot's left strength is required to be greater than or equal to MinRStren.
Pivot points are used to calculate support and resistance levels, with a high pivot indicating the resistance level, and the low pivot indicating a support level. When price penetrates the resistance line as calculated by the high pivot, it is considered a breakout and the resistance level generally becomes the new support level.
![]() This ShowMe study contains alert criteria; when you enable the alert, an alert is triggered each time the price on the current bar breaches a previously un-breached pivot point.
This ShowMe study contains alert criteria; when you enable the alert, an alert is triggered each time the price on the current bar breaches a previously un-breached pivot point.
The approach used in this ShowMe may also provide a more robust alternative to analysis techniques that look for "new highs", since even there, the real event of interest may be the breaching of a previously un-breached significant high point on the chart.
PivotReversalGen