Analysis Techniques & Strategies

| Name | Expression | Default | Description |
| Price | Numeric | Close | Price to consider for the pivot point. |
| LeftStrength | Numeric | 3 | Number of bars before the pivot point that must be higher than the pivot price. |
| RightStrength | Numeric | 3 | Number of bars after the pivot point that must be higher than the pivot price. |
| PlotOffsetTicks | Numeric | 1 | Number of price ticks to offset the plot from the pivot low. |
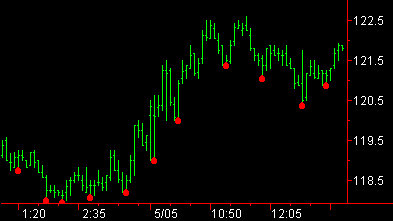
The Pivot Low ShowMe study identifies low pivot points; by default, it places a dot at the low price of the bar minus 1 price tick (minimum price increment amount) when the low price is less than the low price of the three previous bars, and less also than the low price of the subsequent 3 bars bars. You can change the price used to calculate the pivot, the strength of the pivot, and the number of price ticks to offset the plot from the pivot low price.
Pivot points are used to calculate support and resistance levels, with a low pivot indicating the support level, and the high pivot indicating a resistance level. When price penetrates the support line as calculated by the low pivot, it is considered a breakout and the support level generally becomes the new resistance level.
![]() This ShowMe study contains alert criteria. When you enable the alert, an alert is triggered each time a pivot point is found. Due to how pivot points are calculated, you will be notified x number of bars after the pivot point has occurred (where x is the number you use for the RightStrength input).
This ShowMe study contains alert criteria. When you enable the alert, an alert is triggered each time a pivot point is found. Due to how pivot points are calculated, you will be notified x number of bars after the pivot point has occurred (where x is the number you use for the RightStrength input).