Analysis Techniques & Strategies

| Name | Expression | Default | Description |
| PriceH | Numeric | High | The high price to compare between the current and previous bar. |
| PriceL | Numeric | Low | The low price to compare between the current and previous bar. |
| PlotPrice | Numeric | Close | Price for positioning the pattern marker. |
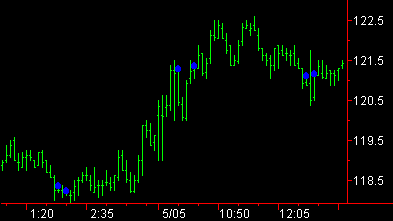
Inside Bar marks the close of any inside bars — when the High is lower than the previous bar's High and its Low is higher than the previous bar's Low. An inside bar indicates very little activity in that market for the time period used to create the chart (for example, intraday, daily, weekly, monthly, and so on). Clusters of inside bars may indicate a stagnant or sideways market. Many analysts view inside bars as an indication of declining market activity, possibly as a prelude to a large movement in either direction.
![]() Some traders consider a bar an inside bar if the High and Low are equal to the previous bar or note where there are several consecutive bars that are within a range of a previous bar. The Inside Bar ShowMe Study will not mark bars that meet either of these conditions.
Some traders consider a bar an inside bar if the High and Low are equal to the previous bar or note where there are several consecutive bars that are within a range of a previous bar. The Inside Bar ShowMe Study will not mark bars that meet either of these conditions.