Analysis Techniques & Strategies

| Name | Expression | Default | Description |
| PriceH | Numeric | High | High value used in calculating the slow Stochastic value. |
| PriceL | Numeric | Low | Low value used in calculating the slow Stochastic value. |
| PriceC | Numeric | Close | Value compared to high and low values when calculating the slow Stochastic value. |
| Length | Numeric | 14 | Number of bars used to calculate the slow Stochastic value. |
| OverSold | Numeric | 20 | Level at which a market would be considered oversold. |
| OverBought | Numeric | 80 | Level at which a market would be considered overbought. |
| OverSColor | Numeric | Cyan | Bar color when oversold conditions are present. |
| OverBColor | Numeric | Red | Bar color when overbought conditions are present. |
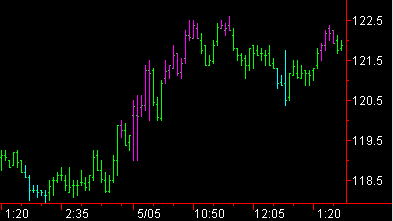
The Stochastic SlowK PaintBar study paints in cyan all bars during which the market is considered overbought, and in magenta all bars during which the market is considered oversold.
This study calculates a Slow Stochastic value (SlowK) using the three prices and the number of bars specified by the inputs. When the Slow Stochastic value is less than the value in the OverBought input, the market is considered to be overbought; and when it is greater than the value in the OverSold input, it is considered to be oversold.
The SlowK value is a Stochastic oscillator smoothed with a moving average technique, and is used to indicate overbought and oversold conditions in the market based on the premise that during periods of price decreases, the closing prices of the bars tend to accumulate near the low of the bar, and during periods of price increases, the closing prices tend to accumulate near the high of the bar.
![]() This PaintBar study contains alert criteria. When you enable the alert, an alert is triggered when the market is either overbought or oversold. For more information regarding the EasyLanguage colors available, see EasyLanguage Colors and Their Corresponding Numeric Values.
This PaintBar study contains alert criteria. When you enable the alert, an alert is triggered when the market is either overbought or oversold. For more information regarding the EasyLanguage colors available, see EasyLanguage Colors and Their Corresponding Numeric Values.