TradeStation Help
When you apply the indicator to your chart, it will plot graphically on your screen, either in the same subgraph as the price data on which it is based, or in a separate subgraph. The current value for the indicator is listed either in the chart status line (when plotted in the same subgraph) or the indicator status line (when plotted in a separate subgraph).
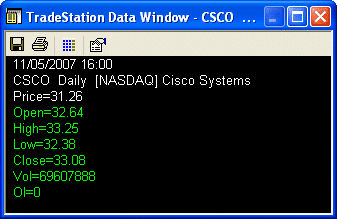
In addition to viewing the indicator graphically, you can also access and view the values, on a bar-by-bar basis, using the Data window. The Data window displays the open, high, low, close, volume and open interest (if applicable) for each bar for each symbol plotted on the active chart along with the values for all indicators in the chart. The values are shown bar by bar, and for each plot for each indicator. The Data window enables you to quickly and easily view exact indicator values for each bar of data on your chart. You can also print the Data window or export it to an ASCII file.
As you point to different bars on the chart, the Data window scrolls to and underlines the bar to which you are pointing. You can change the view of the Data window from all bars to only values for the selected bar. For information, see About the Data window. To view the Data window, your chart must be the active window.
![]() Activate a Chart Analysis window. Access using the menu bar View > Data Window menu sequence. The Data Window is now displayed.
Activate a Chart Analysis window. Access using the menu bar View > Data Window menu sequence. The Data Window is now displayed.
