TradeStation Help
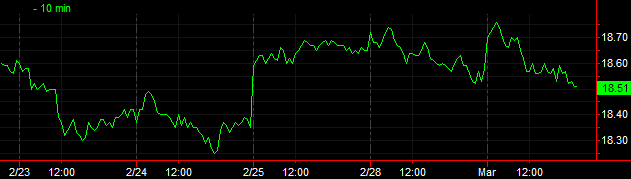
A line chart is created by drawing a line that connects all the closing prices over the data interval period. For example, in a chart with a daily data interval, the line connects the closing prices for each day, whereas in a chart with a 10-minute data interval, the line connects the last tick price in the 10-minute period.
You can apply any analysis technique to a line chart. Only the close price is plotted, but all data is available for analysis.