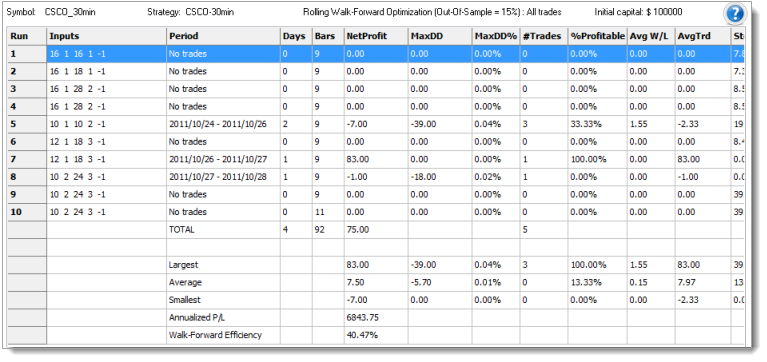
TradeStation Walk-Forward Optimizer
After a walk-forward optimization has been completed, the Walk-Forward Summary (Out-Of-Sample) tab provides a summary of the out-out-sample window performances. This table also calculates and compares annualized rates of return for the in-sample and out-of-sample results. This statistic is the Walk-Forward Efficiency (also called the walk-forward efficiency).

As a rule of thumb, a Walk-Forward Efficiency of 50% or more is considered a measure of a successful walk-forward analysis.
The distribution of profit, loss and trades is also a primary consideration. The more even the distribution of these elements, the better. Note that a walk-forward analysis can be invalidated by any unusually large win, winning run or winning time period that contributes more than 50% of total net profit.
The Risk/Reward ratio (R/R ratio) is the annualized profit divided by the maximum drawdown for the period and provides a very useful index to monitor stability across different runs.
Most users will concentrate on analyzing the Walk-Forward Summary. (refer to General FAQ How do I select the best/most robust strategy when using the Walk-Forward Optimizer (WFO)? for more detail)
However, for your convenience, the WFO automatically validate/invalidate a walk-forward analysis without the user needing to study all the figures in detail to reach the same conclusion: