TradeStation Walk-Forward Optimizer
When viewing the results of a Walk-Forward Analysis, the Graphs tab lets you view the results for a set of Walk-Forward runs based on the specified equity factor.
Access from the TradeStation WFO
by selecting a WFA and clicking the Graphs tab.
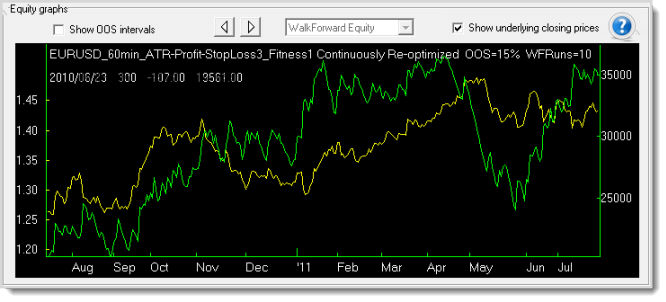
Shows the accumulated Walk-Forward equity of the selected WFA over time as a green graph line using the scale on the right axis.
- Show OOS intervals - Checking this setting displays vertical lines where each out-of-sample interval occurred during each walk-forward run.
- Left - Right Arrows - Scrolls the graph to the left or right to see additional graph data.
- [Walk-Forward Equity] - The selected graph type (greyed out if only one available).
- Show underlying closing prices - Checking this setting superimposes a yellow line that indicates closing prices (show on the left axis).
