TradeStation Walk-Forward Optimizer
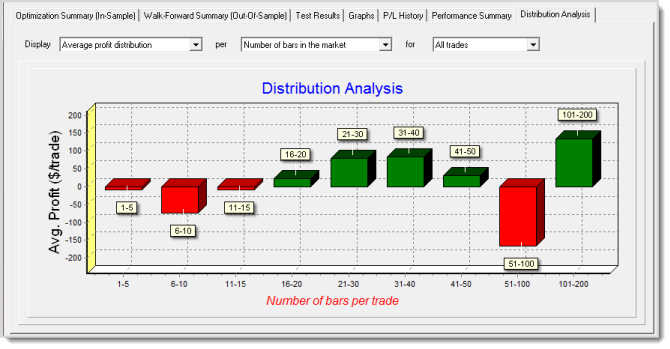
When viewing the results of a Walk-Forward Analysis, the Distribution Analysis tab at the far right of the results tabs lets you display various graphs that can help you analyze the tendencies and behaviors of the strategy trades by comparing specific performance values against underlying market criteria.
Performing a distribution analysis on a set of optimization results can help you identify how market conditions may have an impact on all or part of strategy performance. For example, is there a particular time of day where an intra-day strategy is more profitable, or is there a correlation between how long a position is held and the percentage of profitability?
Access from the TradeStation WFO
by running a WFA and clicking the Distribution Analysis tab.

The Distribution Analysis graph allows you to view and evaluate various
performance criteria (Y-axis) against various market criteria (X-axis)
to assist you in identifying where and when a strategy might be strongest
or weakest.