Analysis Techniques & Strategies

| Name | Expression | Default | Description |
| AvgLength | Numeric | 50 | Period, expressed in bars, for which to calculate the average volume. |
| UpColor | Numeric | Cyan | Color in which volume is displayed when the price closes higher than the previous bar. |
| DownColor | Numeric | Red | Color in which volume is displayed when the price closes lower than the previous bar. |
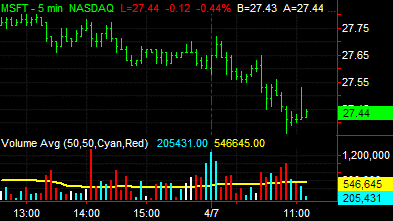
The Volume Average indicator plots a 50-bar average of the volume overlaid on the current volume. You can change the number of bars used to calculate the average.
| Number | Name | Default Color | Description |
| Plot1 | Volume | Cyan/Red | Plots the current volume. |
| Plot2 | Volume Avg | Yellow | Plots the average of the volume. |
When applied to a chart, this indicator displays two plots in a subgraph separate from the price data.