Analysis Techniques & Strategies

| Name | Expression | Default | Description |
| CCILength | Numeric | 14 | Number of bars used to calculate the CCI. |
| CCIAvgLength | Numeric | 9 | Number of bars used to calculate the average of the CCI. |
| OverSold | Numeric | -100 | Value used to determine a bearish/oversold market. |
| OverBought | Numeric | 100 | Value used to determine a bullish/overbought market. |
The Commodity Channel Index Average, like the Commodity Channel Index, is used primarily to identify beginning and ending of cycles in futures markets and is commonly used to identify buy and sell opportunities. The CCI is calculated so that 70-80% of all price activity falls between +100 and -100 on its vertical scale. Many analysts believe a long position is indicated when the CCI exceeds +100 while a short position is indicated when the CCI falls below -100 but these values should be based more on your market analysis. For example, you may decide that for the market you are evaluating, a -125 indicates taking a short position while a +150 indicates taking a long position.
Many analysts also use this indicator to indicate overbought and oversold markets, much like an oscillator. Breakouts above the OverBought line indicate an overbought market and breakouts below the OverSold line indicate an oversold market. The CCI often misses the early part of a new move because of the amount of time it spends in the neutral position (between the OverBought and OverSold lines). Many analysts believe the CCI Average crossing above or below zero identifies market conditions before the OverBought and OverSold lines are crossed.
| Number | Name | Default Color | Description |
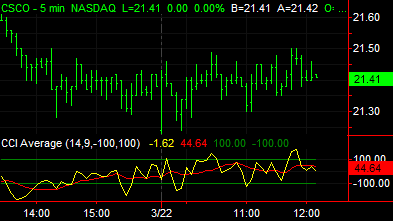
| Plot1 | CCI | Yellow | Plots the CCI as a line. |
| Plot2 | CCIAvg | Red | Plots the average of the CCI as a line. |
| Plot3 | OverBot | Dark Green | Plots the overbought reference line. |
| Plot4 | OverSld | Dark Green | Plots the oversold reference line. |
When applied to a chart, this indicator contains four plots, displayed in a separate subgraph from the price data.