Analysis Techniques & Strategies
| Name | Expression | Default | Description |
| Length | Numeric | 14 | Number of bars used to calculate %R. |
| OverSold | Numeric | 20 | Value identifying the oversold region. |
| OverBought | Numeric | 80 | Value identifying the overbought region. |
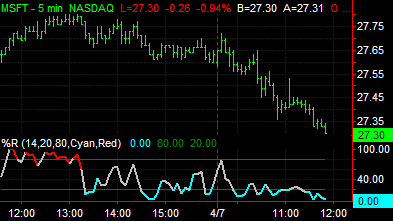
The %R indicator is an overbought / oversold oscillator that is best applied to choppy markets and markets locked in a sideways price pattern or trading range. It can also be used to indicate when to buy on troughs in bull markets and sell on rallies in bear markets. In general, this indicator can help you take advantage of shorter-term countertrend moves occurring within longer-term trends.
An oversold market is believed to occur when the %R line is less than the OverSold line. Conversely, an overbought market is believed to occur when the %R line is greater than the OverBought line.
| Number | Name | Default Color | Description |
| Plot1 | %R | Gray | Plots the %R value. |
| Plot2 | OverBot | Dark Green | Plots the overbought reference line. |
| Plot3 | OverSld | Dark Green | Plots the oversold reference line. |
When applied to a chart, this indicator contains three plots, displayed in a separate subgraph from the price data.