
OptionStation Pro
The Settings panel enables you to adjust the way you view and work with options, including:
Common options attributes - Volatility, Interest Rates, and Pricing Model
Risk Graph settings, including 2D graph plots
Option Chain display parameters
Real Position and Order account settings
Sections - The settings are grouped together into sections.
The items in each section can be listed by clicking ![]() on the category title line to expand the list or by clicking
on the category title line to expand the list or by clicking ![]() to collapse the section.
to collapse the section.
Mini-Help - Highlighting any item (see cursor above) in the Settings panel will display a brief 'mini-help' description for that item in the bottom section of the panel (see blue text above). You can resize the panel and drag the horizontal dividing line up/down to increase the size of the description section.
The Common section lets you manage settings that apply to the source and calculation parameters for volatility.
Stock Volatility Source - Contains a drop-down list that lets you select how stock volatility will be calculated. Be aware that the calculations are subject to an automated "Switch-Over" technique that automatically uses a different method to calculate volatility if the selected method becomes unreliable because of missing or insufficient data. The switch occurs in the following order starting from the current selection: VIX -> Historical -> Fixed.
Fixed - Specifies the fixed volatility as a percent to be used when Fixed is selected.
Allow Trim - When checked, lets you specify the Trim Value for the selected stock volatility.
Options Volatility Source - Contains a drop-down list that lets you select the whether to use Implied volatility or the technique selected for Stock Volatility Strategy (see above). Note that if VIX is selected, an automatic "Switch-Over" to the Stock Volatility Strategy may occur if there the calculation becomes unreliable.
The Graph section allows you to define the view in your Risk Graph based on the item parameters you select. This is a valuable tool in evaluating potential trades and testing how they would profit from market changes and time variables.
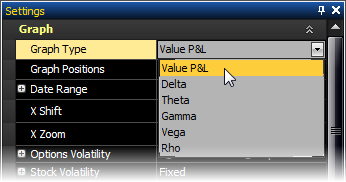
Graph Type - Contains a drop-down list of different types of data that can be plotted in the Risk Graph. You can choose Value P&L, Delta, Theta, Gamma, Vega, or Rho to be plotted in the Y axis (along the left side) of the graph. The Stock price is fixed on the X axis along the bottom.
For example, on a two line Value P&L (Profit and Loss) graph, the white line (using the default colors) on the Risk Graph represents the current day's P&L and the cyan line represents the P&L at expiration date. The dates of the plots are listed at the top. Asset price is shown along the bottom (X-Axis). Profit or Loss in dollars is shown along the left side (Y-Axis). The probability cone (red line) may optionally appear the bottom half of the graph.
Graph Positions - Contains a drop-down list allowing you to select the positions to graph: Real, Theoretical, or both.
Date Range - Controls the amount of time the graph will have available to plot. By default, Now - To Earliest Expiration is selected, however, you can set it to Now - To Latest Expiration or Custom.
If you choose a Custom
date range, clicking on the  button
will show the Date boxes for the From
and To fields. Click the
From/To fields to open a calendar to select specific dates.
button
will show the Date boxes for the From
and To fields. Click the
From/To fields to open a calendar to select specific dates.
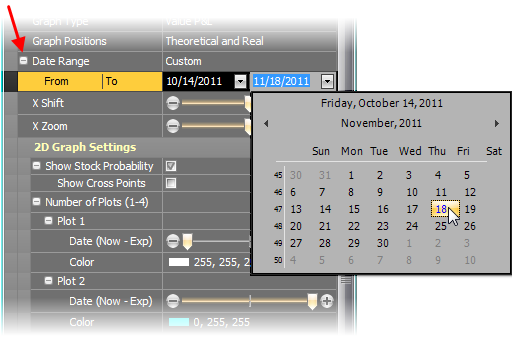
It should be noted that changing the From date redefines what is considered the “Now” date in other controls. Likewise, changing the To date redefines the “Exp” date.
X-Shift - A slider that allows you to move the prices at the bottom of the graph (X-axis) to the right or left.
X-Zoom - A slider that allows you to move the prices at the bottom of the graph closer together to fit more prices on the screen or further apart.
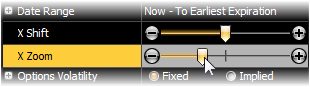
Options Volatility - Allows you to choose the desired volatility type to use for your options. Changing this setting affects the plot(s) of the Risk Graph before expiration and the Price Point values.
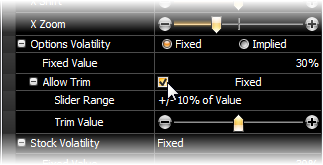
- Fixed - Allows you to enter a percentage in the Fixed Value line. This value will then be used for Options Volatility until it is changed again.
- Implied (default) - Uses Implied Volatility as calculated from the current option price.
Fixed Value - The fixed percentage value for volatility.
![]() OptionStation
Pro allows you to see what would happen to your position if IV increases
or decreases in more than one way. First,
let's assume the current IV on your position is 40% and you want to see
how it would change if IV increased to 70%. To
do this you can change the Options
Volatility setting from Implied to Fixed
and then enter 70% in the Fixed Value box. This will adjust the plots
on the Risk
Graph to show the changes with 70% IV and update the Price
Point values.
OptionStation
Pro allows you to see what would happen to your position if IV increases
or decreases in more than one way. First,
let's assume the current IV on your position is 40% and you want to see
how it would change if IV increased to 70%. To
do this you can change the Options
Volatility setting from Implied to Fixed
and then enter 70% in the Fixed Value box. This will adjust the plots
on the Risk
Graph to show the changes with 70% IV and update the Price
Point values.
Allow Trim - Allows you to select 3 different ranges of value, expressed as a percentage of the current Implied Volatility. They are +/-10% of Value, +/-50% of Value, and +/-100% of Value. These will set the range of the Trim Value slider tool to the specified values.
Trim Value
- Changes the value specified
in the Allow Trim setting. Clicking
the or  allows you
to fine tune the setting. For example, if we have 40% as our Fixed value and set
the slider range to +/-100% of Value, sliding
the Trim Value to 175% of Fixed Value will
also show how the position would be affected by a rise in IV from 40%
to 70%.
allows you
to fine tune the setting. For example, if we have 40% as our Fixed value and set
the slider range to +/-100% of Value, sliding
the Trim Value to 175% of Fixed Value will
also show how the position would be affected by a rise in IV from 40%
to 70%.
Stock Volatility - Allows you to desired stock volatility type to use for your options. Changing this setting affects the plot of the Probability Cone, and will be the number you will see in the left mid section of the Graph under Probability (Volatility=%).
- Fixed - Allows you to enter a percentage in the Fixed Value line. This value will then be used for Stock’s volatility at all times.
- Historical - Uses Historical or Actual volatility of the Stock as recorded by price movement over a period of time.
- VIX Index - Calculates the volatility for the stock based on the CBOE's VIX formula.
Stock
Volatility also has the same features as Options
Volatility (see above) allowing you to select Allow Trim and the Trim
Value range of the slider tool. The
slider tool can also be advanced using the
and
buttons on each end of the slider.
The 2D Graph Settings is a sub-section of the Graph section that includes settings to control the number of plots and their appearance in the 2D Graph panel.
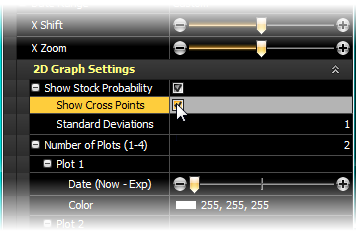
Show Stock Probability - When checked, displays the Probability Cone beneath the Risk Graph.
Show Cross Points - When checked, draws vertical lines from the Probability Cone up to the Risk Graph to show the standard deviation based on the defined date. The Show Stock Probability box needs to be checked before cross points are able to plot.
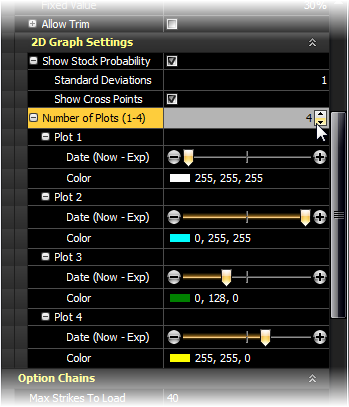
Standard Deviations - Allows you to select +/- 1, +/- 2, and +/- 3 standard deviations for the underlying probability cone. This is useful when performing probability analysis and mathematical expectation analysis on options positions.
Number of Plots - Allows you to draw up to four plots representing four different dates between now and the date of expiration. Enter the number of plots you wish to show on the Risk Graph using the up-down arrows. Typically, one plot would always show today's risk curve and another the risk curve at expiration (this is the default setting for OptionStation Pro). The other plots can be set to any date using the slider control for each plot. For example, you may show one third to expiration for one plot and two thirds to expiration for the second one; giving a graphical view of how time decay affects your position as each plot progresses.
Plot Slider
Control - Each plot has
its own slider control, allowing you to fine tune the date of each plot. The color and date of
the plots will show along the top of the graph. You
can also move a plot incrementally with the slider control using the or buttons at each end of the
slider. For example, to increment 1-day
is a total of 8 clicks. This
allows you to see how much a position can change within a segment of a
day, or by continuing to click, view the change of a curve over several
days.
Plot (n) Color - Each plot automatically uses a different color to distinguish them from each other. When you click on the Color control, a color palette opens revealing many color choices.

Lets you specify the TradeStation account from which you want to view your Real (existing) positions and whether or not to include closed positions.
Include Flat Positions - Displays closed and open positions.
Account - Provides a drop-down list for the accounts to view, and can be set to ALL.
Specifies the default TradeStation account number you want to use for placing orders.
Account - Allows you to choose the default account for the Order Bar.