Analysis Techniques & Strategies

| Name | Expression | Default | Description |
| Price | Numeric | Close | Price used to calculate the average. |
| FastLength | Numeric | 7 | Number of bars used to calculate the 'fast' average. |
| SlowLength | Numeric | 14 | Number of bars used to calculate the 'slow' average. |
| UpColor | Numeric | Cyan | Bar color when the fast average crosses over the slow average. |
| DnColor | Numeric | Red | Bar color when the fast average crosses under the slow average. |
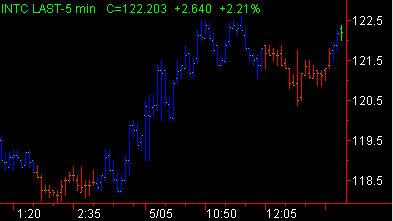
The Mov Avg Crossover PaintBar study calculates a fast and slow moving average and paints the bars depending on the relative position of the averages. It paints in cyan all bars during which the fast moving average is above the slow moving average, indicating an up trend, or bullish period. It paints in red all bars during which the slow moving average is above the fast moving average, which indicates a down trend, or bearish period.
![]() This PaintBar study contains alert criteria; when you enable the alert, an alert is triggered each time the averages cross (indicating that the market is changing from bullish to bearish or vice versa). For more information regarding the EasyLanguage colors available, see EasyLanguage Colors and Their Corresponding Numeric Values.
This PaintBar study contains alert criteria; when you enable the alert, an alert is triggered each time the averages cross (indicating that the market is changing from bullish to bearish or vice versa). For more information regarding the EasyLanguage colors available, see EasyLanguage Colors and Their Corresponding Numeric Values.