Analysis Techniques & Strategies

| Name | Expression | Default | Description |
| AvgLength | Numeric | 50 | Period, expressed in bars, for which to calculate the average volume. |
| AlertPct | Numeric | 50 | Percentage by which volume must be greater than the average. |
| UpColor | Numeric | Cyan | Color in which volume is displayed when the price closes higher than the previous bar. |
| DownColor | Numeric | Red | Color in which volume is displayed when the price closes lower than the previous bar. |
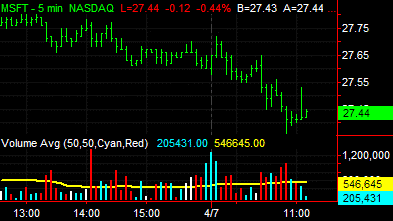
The Volume Average indicator plots a 50-bar average of the volume overlaid on the current volume. You can change the number of bars used to calculate the average.
This indicator contains alert criteria. When you enable the alert in the Format Volume Average dialog box, you will be notified when the current volume breaks out above the average volume by a percentage greater than the percentage specified in the input BreakoutPcnt.
| Number | Name | Default Color | Description |
| Plot1 | Volume | Cyan/Red | Plots the current volume. |
| Plot2 | Volume Avg | Yellow | Plots the average of the volume. |
When applied to a chart, this indicator displays two plots in a subgraph separate from the price data.