Analysis Techniques & Strategies

| Name | Expression | Default | Description |
| Length | Numeric | 9 | Number of bars used to calculate Time Series Forecast (linear regression). |
| BarsPlus | Numeric | 7 | The number of bars forward that the Time Series Forecast line is plotted. |
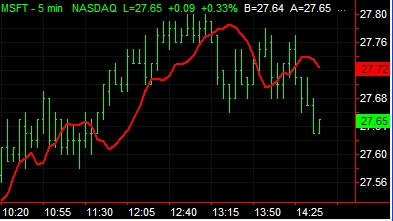
The Time Series Forecast (TSF) indicator is based on linear regression calculations using the Least Squares method. Linear regression is a statistical tool used to predict future market values relative to past values. TSF attempts to "predict" the future value of a market by determining the upward or downward bias of a trend and extending that calculation into the future. For example, if prices are trending up, TSF attempts to logically determine the upward bias of the price relative to the current price and extend that calculation forward. When the market price is above the indicator, the trend is considered up. When the market price is below the indicator, the trend is considered down. Additionally, many analysts believe when prices rise above or fall below the indicator line, prices will likely pull back to the line. The TSF indicator also monitors the current trend to determine if a change in direction occurred.
The Time Series Forecast indicator is similar to the Linear Regression indicator with the exception of two significant differences. The first difference is that TSF plots its line forward (to the right of the chart) by the number of bars specified by the BarsPlus input. The second difference is the default Length input value used for the TSF is much shorter because the plot line is extended forward. A larger Length input would create a grossly exaggerated plot and would not be as reliable as a shorter-term length when analyzing trends and price activity.
| Number | Name | Default Color | Description |
| Plot1 | TSF | Red | Plots the Time Series Forecast value. |
When applied to a chart, this indicator contains one plot, displayed in the same subgraph as the price data. When applied to a grid, this indicator displays one value in a column of cells.