Analysis Techniques & Strategies
| Name | Expression | Default | Description |
| NumSubSessionsAgo | Numeric | 1 | The number of periods ago to reference. |
| StartTime | DateTime | 0930 | The starting time of the period to reference. |
| EndTime | DateTime | 1600 | The starting time of the period to reference. |
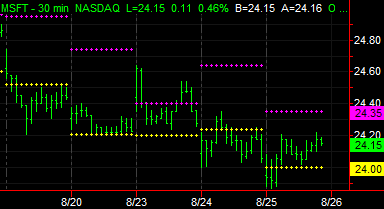
The Subsession Hi-Lo Lines indicator plots the period high and period low for a specified time period ago. By default, it's set to plot the high and low of the previous day's regular session (9:30am - 4:00pm est).
| Number | Name | Default Color | Description |
| Plot1 | SubSessHigh | Magenta | The high price of N session days ago. |
| Plot2 | SubSessLow | Yellow | The low price of N session days ago. |