Analysis Techniques & Strategies

| Name | Expression | Default | Description |
| Price | Numeric | Close | Price used to calculate the Linear Regression Average. |
| LinRegLength | Numeric | 21 | Length used to calculate the average of the Linear Regression Average. |
| SmoothingLength | Numeric | 3 | Number used to determine the degree of smoothing. |
| NumStdErrsUp | Numeric | 2 | Number of standard errors to be added to the moving average of the linear regression values to calculate the upper standard error band. |
| NumStdErrDn | Numeric | -2 | Number of standard deviations to be added to the moving average of the linear regression values to calculate the lower standard error band. |
| Displace | Numeric | 0 | Number of bars to displace the plots. |
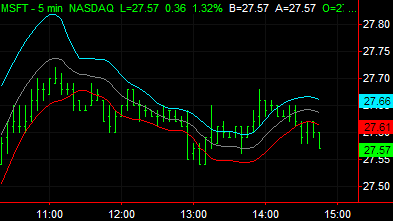
The Standard Error Bands indicator is an attempt to show the trend and the volatility around the trend. This indicator produces three plots. The middle plot is the ending value of a 21-period linear regression line. The upper plot, the upper standard error band, is the result of adding two standard errors to the ending value of the regression line. The lower plot, the lower standard error band, is a result of subtracting two standard errors from the end value of the linear regression line. Since large changes in the closing price can greatly affect the values of the line and error bands, a three period (bar) simple moving average is plotted using the ending value of the regression line and the standard errors.
Although the Standard Error Bands are similar to Bollinger bands they are interpreted differently. Standard Error Bands show the direction of the current trend and the volatility around it. Bollinger bands show the volatility around the average of the plotted price.
One method of using the Standard Error Bands is to look for the bands to tighten as price starts to move (upward or downward). When this occurs it is said that price tends to trend easily. The bands will often remain tight as long as the trend is strong. At the same time, the Linear Regression line will likely keep rising or falling depending on the direction of the trend. Once the Bands start to widen, it is indicative of the price slowing down. This may be followed by the Linear Regression line leveling off and possibly reversing, a sign that the trend may be nearing its end.
| Number | Name | Default Color | Description |
| Plot1 | UpperBand | Cyan | Plots the upper band value. |
| Plot2 | LowerBand | Red | Plots the lower band value.. |
| Plot3 | MidLine | Dark Gray | Plots the Linear Regression average value. |
When applied to a chart, this indicator contains three plots, displayed in the same subgraph as the price data.
Anderson, Jon [1996], "Standard Error Bands," Technical Analysis of Stocks and Commodities, Volume 14: September