Analysis Techniques & Strategies
| Name | Expression | Default | Description |
| ReferenceSymbol | String | "SPY" | The reference symbol to be compared to the current symbol. |
| Length | Numeric | 10 | Number of bars over which percent change is calculated. |
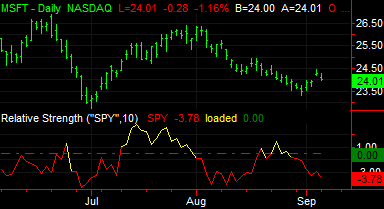
The Relative Strength indicator calculates the difference in percentage change (relative strength) between the current symbol and a reference symbol over a specified number of bars. A positive difference plots in yellow line above the zero line and a negative difference plots in red below the zero line.
The Relative Strength indicator makes use of a PriceSeriesProvider component that accesses price data for a reference symbol so that it does not require a multi-data chart and so it will work in a grid application.
This study only works with daily, weekly, or monthly bars.
| Number | Name | Chart Color | Description |
| Plot1 | RefSym | Red | Shows the name of the reference symbol. |
| Plot2 | Diff | Yellow/Red | Plots the difference in the relative strength percentages. |
| Plot3 | DataState | Yellow | Plots the load state of the reference symbol data. |
| Plot4 | ZeroLine | Green | Plots the a line at zero to delimit positive and negative values. |