Analysis Techniques & Strategies

| Name | Expression | Default | Description |
| Price | Numeric | Close | Price used to calculate the moving averages. |
| FastLength | Numeric | 9 | Number of bars to include in calculation of the fast (shorter) moving average. |
| SlowLength | Numeric | 18 | Number of bars to include in calculation of the slow (longer) moving average. |
| ColorNormLength | Numeric | 14 | Number of bars over which to normalize the indicator for gradient coloring. |
| UpColor | Numeric | Yellow | Color to use for indicator values that are relatively high over ColorNormLength bars. Set to -1 to disable gradient color plotting. |
| DnColor | Numeric | Magenta | Color to use for indicator values that are relatively low over ColorNormLength bars. Set to -1 to disable gradient color plotting. |
| GridForegroundColor | Numeric | Black | Color to use for numbers in RadarScreen cells when gradient coloring is enabled, that is, when both UpColor and DnColor are set to non-negative values. |
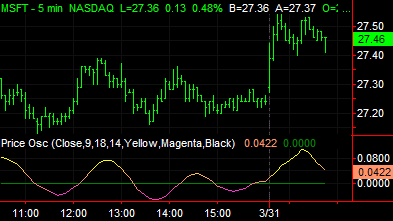
The Price Oscillator indicator calculates a fast, or short, moving average and a long, or slow, moving average. The difference between these two values is then plotted. The moving averages are not plotted. One approach to analyzing moving averages is to note the relative position of the 2 averages: the short moving average above the long moving average would yield a positive Price Oscillator value and be bullish; the short moving average below the long moving average would yield a negative Price Oscillator value and be bearish.
Calculating the difference between the two averages and plotting this as an oscillator makes extreme positive and negative values stand out as possible overbought and oversold conditions.
| Number | Name | Default Color | Description |
| Plot1 | PriceOsc | Yellow/Magenta | Plots the price oscillator value. |
| Plot2 | ZeroLine | Dark Green | Plots a reference line at zero. |
When applied to a chart, this indicator displays two plots in a separate subgraph from the price data.
Set either UpColor and/or DnColor to -1 to disable gradient plot coloring. When disabled, Plot1 color is determined by settings in indicator properties dialog box. Plot2 (ZeroLine) color always comes from indicator properties dialog box.