Analysis Techniques & Strategies

| Name | Expression | Default | Description |
| Length | Numeric | 14 | Number of bars to include in calculation. |
| AlertLength | Numeric | 14 | Number of bars to include in alert calculation. |
| OverSold | Numeric | 20 | Money Flow value to be considered oversold. |
| OverBought | Numeric | 80 | Money Flow value to be considered overbought. |
| OverSColor | Numeric | Cyan | Plot color for oversold values. |
| OverBColor | Numeric | Red | Plot color for overbought values. |
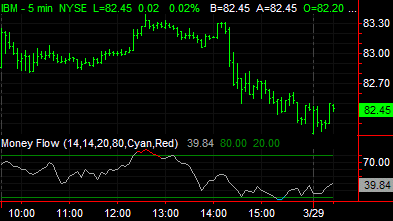
The Money Flow indicator calculates an indexed value based on price and volume for the number of bars specified in the input Length. Positive Money Flow is calculated and summed for each of the last Length number of bars with an average price greater than the previous bar and then divided by the Money Flow for all the bars specified in Length. The use of both price and volume provides a different perspective from price or volume alone. The Money Flow indicator tends to show dramatic oscillations and can be useful in identifying overbought and oversold conditions.
| Number | Name | Default Color | Description |
| Plot1 | MoneyFlow | LightGray | Plots the Money Flow as a line. |
| Plot2 | OverBot | Dark Green | Plots the overbought reference line. |
| Plot3 | OverSld | Dark Green | Plots the oversold reference line. |
When applied to a chart, this indicator displays three plots in a separate subgraph from the price data.