Analysis Techniques & Strategies

| Name | Expression | Default | Description |
| AdvIssues | Numeric | Close of Data1 | Price data representing advancing issues. |
| AdvVol | Numeric | Close of Data2 | Volume of advancing issues. |
| DecIssues | Numeric | Close of Data3 | Price data representing declining issues. |
| DecVol | Numeric | Close of Data4 | Volume of declining issues. |
| SmoothingLength | Numeric | 14 | Number of bars used to average the Market Thrust. |
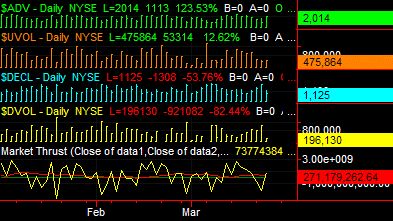
The Market Thrust indicator is used to identify overbought / oversold markets based on advancing and declining issues and volume. Market Thrust weighs the number of advancing and declining issues by its respective volume and subtracts these results: (# of advancing issues * advancing volume) - (# of declining issues * declining volume). This indicator also calculates an average of the Market Thrust. This average differs from the Market Thrust calculation in that the average is less sensitive to short, quick reversals. Therefore, the average Market Thrust produces a "smoother" calculation compared to the daily Market Thrust calculation.
In order to return significant results, Data1 & Data2 should represent advancing issues and Data3 & Data4 should represent declining issues. Please refer to the notes below for important information pertaining to data required to plot this indicator.
| Number | Name | Default Color | Description |
| Plot1 | RawMktThr | Yellow | Plots Market Thrust as a line. |
| Plot2 | MktThr | Red | Plots the average of Market Thrust as a line. |
| Plot3 | ZeroLine | Dark Green | Plots a horizontal line at zero. |
When applied to a chart, this indicator contains three plots, displayed in a separate subgraph from the price data.
![]() In order to apply the Market Thrust indicator to a chart, you must plot two symbols. Data1 represents the number of advancing issues and Data2 their up volume. Data3 represents the number of declining issues and Data4 their down volume. Historically, Market Thrust is applied to the NYSE Advancing issues (Data1) and NYSE Declining Issues (Data3). This data is normally reported as daily data.
In order to apply the Market Thrust indicator to a chart, you must plot two symbols. Data1 represents the number of advancing issues and Data2 their up volume. Data3 represents the number of declining issues and Data4 their down volume. Historically, Market Thrust is applied to the NYSE Advancing issues (Data1) and NYSE Declining Issues (Data3). This data is normally reported as daily data.