Analysis Techniques & Strategies

| Name | Expression | Default | Description |
| Price | Numeric | Close | Price used to calculate linear regression. |
| Length | Numeric | 9 | Number of bars used to calculate linear regression. |
| Displace | Numeric | 0 | The number of bars to displace the plot of the linear regression curve. |
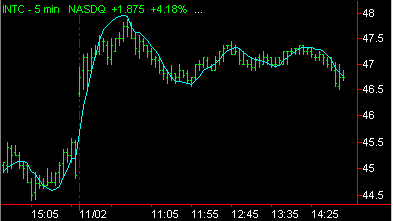
Linear regression is a statistical tool used to predict future market values relative to their past values, and is normally plotted on a price chart as a straight line like a trendline. The Linear Regression indicator, however, does not plot a straight line - when it is plotted, it curves through price activity. Its curve is a result of plotting a line through each end point of invisible linear regression trendlines. Each invisible trendline plots the minimal distance between closing prices, using the "least squares" method, over the number of bars defined in the input, Length.
The indicator helps to determine where a market's price might be in the near future using current and past price history. If prices are trending up, linear regression attempts to logically determine what the upward bias of the price may be relative to the current price. If prices are trending down, it will attempt to determine the downward bias of the price. Some analysts believe that when prices rise above or fall below the linear regression line, they are overextended and will begin to move back towards the line. Thus, the line is used to monitor when a price move may change direction.
| Number | Name | Default Color | Description |
| Plot1 | LinReg | Cyan | Plots linear regression. |
When applied to a chart, this indicator contains one plot, displayed in the same subgraph as the price data.