Analysis Techniques & Strategies

There are no inputs for this indicator.
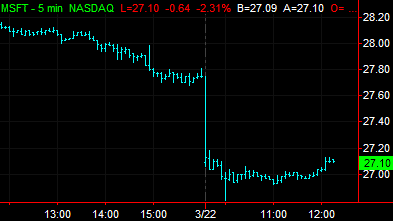
The Gapless Bar Chart indicator reconstructs the bar chart using True High and True Low instead of simply high and low. True High is the greater of the current high or the previous bar's close. True Low is the lesser of the current low or the previous bar's close. This effectively removes any gaps from the chart.
| Plot Number | Plot Name | Default Color | Description |
| Plot1 | TrueHigh | Cyan | Plots the True High as a Bar High. |
| Plot2 | TrueLow | Cyan | Plots the True Low as a Bar Low. |
| Plot3 | Open | Cyan | Plots the Open as a Left Tick. |
| Plot4 | Close | Cyan | Plots the Close as a Right Tick. |
When applied to a chart, this indicator displays the four plots, as bars, in the same subgraph as the price data.