Analysis Techniques & Strategies

| Name | Expression | Default | Description |
| MyMargin | Numeric | 1000 | Margin requirement in dollars. |
| MyCommission | Numeric | 25 | Commission amount in dollars. |
| Length | Numeric | 14 | Number of bars used to calculate the CSI. |
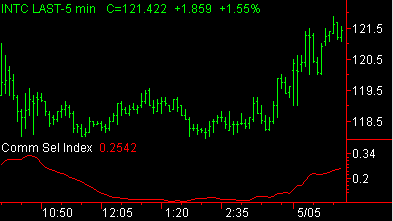
CSI measures a market's volatility and trending strength in relation to the costs involved in taking a position in that market. To calculate this value, the indicator considers directional movement, volatility, margin requirements, and commission costs. CSI identifies volatile markets for short-term trading and is widely used to compare the short-term risks associated with various futures contracts. Generally speaking, a higher relative value indicates a security with better trending and volatility characteristics, while a lower value is considered less attractive.
| Number | Name | Default Color | Description |
| Plot1 | CSI | Red | Plots the CSI value. |
When applied to a chart, this indicator contains one plot, displayed in the same subgraph as the price data.