Analysis Techniques & Strategies

| Name | Expression | Default | Description |
| AlertLength | Numeric | 14 | Number of bars used to calculate a new high or low. |
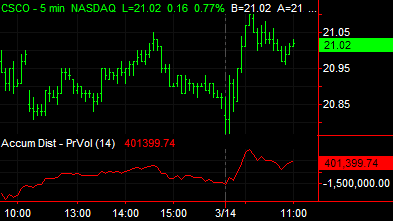
The Accum Dist - PrVol indicator uses the relationship between the open and the close of the bar, and the range of the bar, to weight and characterize the volume as Accumulation (buying) or Distribution (selling). The use of both price and volume provides a different perspective from price or volume alone. The calculation of Accumulation Distribution on each bar is added to the running total from the previous bars on the chart. Because Accumulation Distribution begins accumulating values from the left of the chart, the numeric value of Accumulation Distribution will depend on the data available in the chart. Therefore, the relative value, or trend direction, of Accumulation Distribution is more important than its numeric value. A divergence between price and Accumulation Distribution may indicate a trend reversal.
| Number | Name | Default Color | Description |
| Plot1 | AccDst-PrVol | Red | Plots Accumulation Distribution |
When applied to a chart, this indicator displays one plot in a separate subgraph from the price data.