TradeStation Help
All options positions are based on the four basic legs: long call, long put, short call and short put, and some positions might also include the underlying asset. For more information, see Four Basic Legs in Options Trading.
These positions comprise various search strategies. A search strategy is bullish, bearish, or neutral in relation to the underlying asset. Visualizing these positions will help you understand how these positions are used to build search strategies. A position chart is an ideal way to illustrate this concept.
A Position Chart can represent the following:
All Position Charts provide a visual aid to assist in determining the risk and reward of applied search strategies. In short, the basic function of a Position Chart is to enable you to visually analyze and view your position for profitability and risk.
A Position Chart plots the theoretical values of any position that is created within a OptionStation Analysis window. There is a maximum of six plots per Position Chart and each plot may contain an actual or a hypothetical position based on the following factors: underlying asset's price, underlying asset's volatility, and the passage of time. It does this by visually displaying a plot line that depicts the position's value relative to the change upon which you are basing your chart. A Position Chart will demonstrate the risk and reward of the options strategies you select by charting the selected plot types relative to the variable on which your chart is based (price, volatility, or time). You can plot the Position Value P/L, the Greeks, or any of the many various plot types available relative to the chart's variable.
![]() For more information, see
Using Position Charts to Evaluate Theoretical Profit
and Loss.
For more information, see
Using Position Charts to Evaluate Theoretical Profit
and Loss.
A Position Chart is considered a window, and will always be placed inside the workspace containing the OptionStation Analysis window on which it is based. You can insert an unlimited number of Position Charts into a single OptionStation Analysis window. Position Charts associated with a OptionStation Analysis window are available any time the workspace containing the OptionStation Analysis window is open.
An option is considered a wasting asset, and as the expiration date, or dates, of the options comprising your position move closer to expiration, the value of the option and the position decreases. Before the option contract expires you will either close your position by selling (or buying back) the option, buying or selling the underlying asset, or allowing the contract to expire worthless. Options strategies are designed to take advantage of the elements that affect the value of an option by limiting risk and optimizing reward. They are used to manage risk and protect your overall positions. Position Charts help you to assess the impact of these factors.
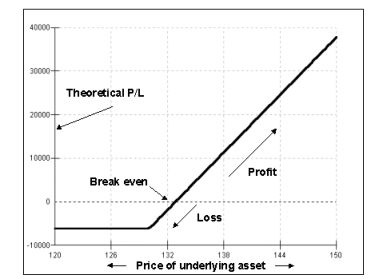
In the example below, the vertical axis of a position chart represents the position or the value of the position being charted, and the horizontal axis represents the Underlying Asset Price range (as it increases and decreases). When you are displaying a Position Chart using real-time/delayed data, the price displayed will be updated as new data is received from your data provider. For end-of-day data, the underlying asset price will be the price at close from the previous day.

By using charts to plot positions and strategies, you can easily see the relationship between the position and the price or volatility of the underlying asset or time decay. As search strategies are built using combinations of the four basic legs, charts are created in different shapes and configurations. You are able to graphically view the risk and reward potential for each position you insert into a Position Chart.
![]() For more information, see Additional
Position Charts.
For more information, see Additional
Position Charts.
Creating a Position Chart in OptionStation Analysis