 Time Series Forecast (Indicator)
Input Information
| Name | Expression | Default | Description |
| Length | Numeric | 9 | Number of bars used to calculate the linear regression. |
| BarsPlus | Numeric | 7 | The offset into the linear regression calculation that determines which previous regression value to plot. |
Market Synopsis
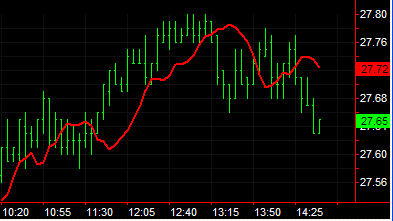
The Time Series Forecast (TSF) indicator is based on a linear regression technique that uses the least squares method to fit a straight line to data points. Linear regression is a statistical tool used to predict future market values relative to past values. The TSF indicator is based on the linear regression calculations of the Linear Reg Curve (LRC) indicator, except that the TSF plots a previous value of the LRC on the current bar, yielding a curve that appears to be shifted to the right of the LRC by BarsPlus bars.
When used in combination with a Linear Reg Curve indicator, the point where the Time Series Forecast crosses the LRC indicates a trend reversal. Because linear regression calculations react faster to price changes and are typically of a shorter length than fast/slow moving averages, the cross tends to happen several bars sooner than a similar a moving average cross resulting in a more responsive signal.
Example
For example, when the default inputs for Length and BarsPlus are used, a 9-bar regression line is calculated and the value that the regression line had 7 bars ago is plotted on the current bar.
Plot Information
| Number | Name | Default Color | Description |
| Plot1 | TSF | Red | Plots the Time Series Forecast value. |
When applied to a chart, this indicator contains one plot, displayed in the same subgraph as the price data. When applied to a grid, this indicator displays one value in a column of cells.