 Mov Avg DEMA (Indicator)
Input Information
| Name | Expression | Default | Description |
| Price | Numeric | Close | Value to be used in calculating the exponential moving average. |
| Length | Numeric | 9 | Number of bars to include in the calculation. |
| Displace | Numeric | 0 | Number of bars to displace the plot. Displacement may be positive (left) or negative (right). |
Market Synopsis
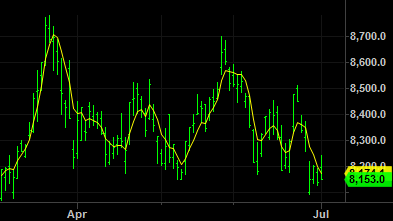
The Mov Avg DEMA indicator calculates and plots the double exponential moving average, specified by the Price input, from each of the most recent number of bars specified by the Length input. This method of calculating a Moving Average gives greater weight to the market's most recent price and a reduced weighting to older prices. (A simple moving average gives equal weight to all the prices in the series.)
A moving average is generally used for trend identification. Attention is given to the direction in which the average is moving and to the relative position of prices and the moving average. Rising moving average values (direction) and prices above the moving average (position) would indicate an uptrend. Declining moving average values and prices below the moving average would indicate a downtrend. A displaced moving average plots the moving average value of a previous bar or later bar on the current bar. This indicator is NOT displaced by default. Changing the input Displace to positive number displaces the plot to the left. Changing the input Displace to a negative number displaces the plot to the right.
Plot Information
| Number | Name | Default Color | Description |
| Plot1 | DEMA | Yellow | Plots the DEMA value. |
When applied to a chart, this indicator displays one plot in the same subgraph as the price data.