Regression Channel Drawing Object
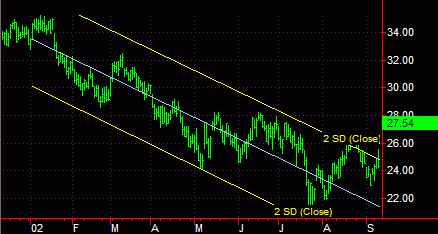
The Regression Channel is an analytical drawing tool that displays a pair of parallel lines above and below a linear regression trendline that is based on a user specified price (High, Low, Open, Close, H+L/2). The Regression Channel contains price movement with the bottom line providing support and the top line providing resistance. A common interpretation is that if prices remain outside the channel for a long period of time, a reversal in trend may be imminent.
The distance of the channel lines from the median line is based on either:
- A user specified number of standard deviations above/below the median line.
- The highest high and lowest low points between the points upon which the median line is based.
You can also use the shortcut menu for a selected object component (identified with small squares) to change the drawing properties such as color, style, weight, and any object specific settings.
Drawing a Regression Channel object
Drawing objects are applied to a chart to assist with data analysis. See About Drawing Objects for more details.
- Activate a Chart Analysis window.
- Use the Drawing > Regression Channel menu sequence. The pointer will change to the shape of three parallel regression lines object.
- Click the desired location for the Regression Channel to begin.
- Move the pointer up, down, left, or right to position the center regression line and the upper/lower lines of the channel, then click to place.
- Optional. Use the Drawing > Snap Mode menu sequence to "snap" the drawing object to the open, high, low, or closing price of the first and last bars the drawing object intersects. For more information, see Snap Mode.
Moving a Regression Channel object
After a regression channel is applied to a chart, you can reposition the drawing tool at any time to bring attention to another group of bars.
- Activate a Chart Analysis window containing a Regression Channel object.
- Select the Regression Channel object (a small square at each moveable point of the channel confirms the drawing object is selected).
- To change the shape of a Regression Channel, drag one of the squares located on a the center line. To move the entire drawing tool horizontally or vertically without changing its shape, drag any portion of the channel.
- Optional. Use the Drawing > Snap Mode menu sequence to "snap" the drawing object to the open, high, low, or closing price of the first and last bars the drawing object intersects.
Customizing the settings of a Regression Channel object
- Select a Regression Channel object (a small square on center linear regression line confirms the drawing object is selected), and select Customize 'Regression Channel' from the shortcut menu.
- Click the Settings tab.
- A Regression Channel consists of upper and lower channel lines based on a linear regression trendline. Under Line, a check mark indicates that the line segment will be displayed. Remove the check mark to hide the line.
- Under Line Color, Line Style, and Line Weight use the drop-down list to change the setting for each segment.
- Under Transparency, enter a value in the % box to change the transparency of each segment where 0% is solid and 100% is invisible.
- Select Extend Left and/or Extend Right to have the channel lines extend to the edge of the chart in either direction.
- Selecting the Use the following color, style and weight for all lines check box will allow the matching properties to be used for all lines. The individual line properties will become unavailable (grayed out).
- Select the Set as Default check box to use these property settings as the default settings for future Regression Channels.
- Click OK.
Customizing the calculation settings of a Regression Channel object
For example, if you base the regression channel on the Open price, the center line is drawn through the Open of the beginning bar of the segment and through the Open of the ending bar of the segment. When you reposition or change the bar spacing, the center line remains fixed to the same price points.
- Select a Regression Channel (a small square on center linear regression line confirms the drawing object is selected), and select Edit 'Regression Channel' from the shortcut menu.
- Click the Calculation tab.
- Under Regression Line, select the price type or formula that the center linear regression line with be Based On.
- Under Channel Lines, select whether the channel lines will be calculated using a user specified number of Standard Deviations above and below the center, or using the Segments High/Low values as determined by the markers used to place the center linear regression line.
- Select Set as Default to use this setting as the default for all future regression channels.
- Click OK.
Related Topics
Customizing the Alerts of a Drawing Object
Customizing the Labels of a Drawing Object