Rectangle Drawing Object
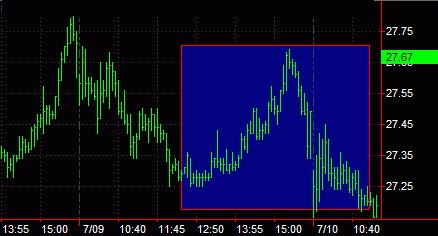
A Rectangle is a non-analytical drawing tool used to highlight specific portions of a chart you believe are significant. For example, Rectangles can highlight a group of bars signifying an upward or downward trending market.
You can also use Rectangles in conjunction with analytical tools. For example, you might use Rectangles to signify what you believe are upward trends. You can then apply a study that identifies upward trends to determine if your non-analytical interpretation meets the study's criteria for an upward trend. Combining non-analytical drawing tools with analytical tools allows you to gauge how well you are able to visually identify market phenomenon before incorporating technical analysis studies in your chart.
You can also use the shortcut menu for a selected object to change the drawing properties such as color, style, weight, and any object specific settings.
Drawing a Rectangle Object
Drawing objects are applied to a chart to assist with data analysis. See About Drawing Objects for more details.
- Activate a Chart Analysis window.
- Use the Drawing > Rectangle menu sequence. The pointer will change to the shape of a Rectangle object.
- Click where you want one corner of the Rectangle to be anchored.
- Move the pointer diagonally to adjust the width and height of the rectangle, then click again to add.
- Optional. Use the Drawing > Snap Mode menu sequence to "snap" the drawing object to the open, high, low, or closing price of the first and last bars the drawing object intersects. For more information, see Snap Mode.
Moving a Rectangle Object
After a Rectangle is applied to a chart, you can reposition the drawing object at any time to bring attention to another group of bars.
- Select the border of the Rectangle (a small square in each corner confirms the drawing object is selected).
- Click a square and drag to resize the Rectangle. Clicking between the squares on the border allows you to move the Rectangle horizontally and vertically without changing its length or width.
- Optional. Use the Drawing > Snap Mode menu sequence to "snap" the drawing object to the open, high, low, or closing price of the first and last bars the drawing object intersects.
Related Topics
Customizing the Settings of a Rectangle
Customizing the Style of a Drawing Object