Gann Fan Drawing Object
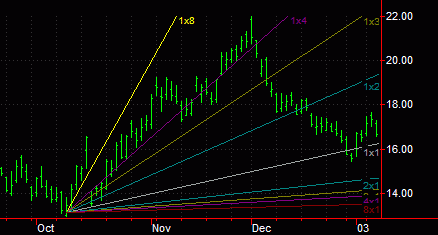
W.D. Gann was a famous trader during the first half of the century who developed a combination of mathematical and geometric principles, which he applied successfully to trading. A Gann Fan is an analytical drawing tool used to identify price breakouts and the strength of those breakouts. The Gann Fan is drawn using a series of angled lines that "fan" out from a single point. These angled lines indicate a price to time relationship that may be relatively fast or relatively slow, depending on the size of the Gann angle.
To help define the time and price line, W.D. Gann took a square and divided it into equal units. He then drew a 45-degree angle line through the square. This became known as the one-by-one time/price line-the time unit equals the price unit; therefore, as the price moves, it tracks along a perfect 45-degree angle because time and price are in perfect balance.
On the other hand, if it takes two units of time for the price to advance one unit that would give you a 2 X 1 time/price line which tracks at approximately a 26.5-degree angle. Conversely, if it takes one unit of time for the price to advance two units, you will have a steeper 1 x 2 line tracking at approximately a 63.5 degree angle. Breakout strength is determined by analyzing the relationship between a market's price and time. For example, a market that moves from $50 to $60 in one week charts differently than a market that moves $50 to $60 in a single day.
Gann Fans are based on the importance of historic or prominent highs and lows. Gann Fan angles can be thought of as trendlines drawn from prominent market tops or bottoms at certain angle(s) determined by the price and time relationship of the market charted. Gann angles are similar to support and resistance levels. If price activity breaks out of one angle, the market will probably trade in that breakout direction until the next Gann angle is met. Generally, a market remaining above a rising line is considered bullish and its resistance level is the next Gann line. Similarly, a market remaining below a falling line is considered bearish. The balance line is drawn at 45 degrees. Breakouts above or below this balance line indicate possible trend changes.
Gann Fans only provide significant results when applied to charts using a Linear because Gann Fans require that each one-point move always remain equidistant from the next, regardless of the price level. The appearance of the Gann angle also depends on the range of numbers that appear on your vertical price axis and the bar spacing defined when you formatted your Chart Analysis window.
Gann Fans can only be applied to charts using Linear scaling. To change your chart's scaling to Linear, see Changing the Chart's Y-Axis. You can also use the shortcut menu for a selected object component (identified with small squares) to change the drawing properties such as Color, Style, Weight, and any object specific settings.
Drawing a Gann Fan Object
Gann Fans can only be applied to charts using Linear scaling. To change your chart's scaling to Linear, see Changing the Chart's Y-Axis.
- Activate a Chart Analysis window.
- Use the Drawing > Gann Fann menu sequence. Your pointer will change to the shape of fan.
- Click on the exact point where the origin of the Gann Fan is to be placed.
- Optional. Use the Drawing > Snap Mode menu sequence to "snap" the Gann Fan to the open, high, low, or closing price of the first bar to which the Gann Fan is applied. For more information, see Snap Mode.
When drawing a Gann Fan over an uptrend, the fan should be drawn upward to the right from a market low, and in a downtrend, the fan should be drawn down to the right from a market high. For more information, see Customize the Settings of a Gann Fan.
Moving a Gann Fan Object
After a Gann Fan is applied to a chart, you can reposition the drawing object at any time to evaluate another group of bars.
- Activate a Chart Analysis window containing a Gann Fan object.
- Select the Gann Fan (a small square at the point where the Gann lines "fan out" confirms the drawing object is selected) and drag horizontally or vertically to reposition the Gann Fan.
- Optional. Use the Drawing > Snap Mode menu sequence to "snap" the Gann Fan to the open, high, low, or closing price of the first bar to which the Gann Fan is applied.
Customizing a Gann Fan Settings
Using this tab, you can modify the values used to draw a Gann Fan. The three factors determining how a Gann Fan is draw are the Time/Price Gann Lines, the direction of the Gann Fan, and the points per bar. Following is a description of how each factor is calculated.
- Time/Price Gann Lines - These lines are comprised of two values: time and price (for example, 8 x 1, 4 x 2, 1 x 2, and so on). Time is represented by the number of bars and price is represented by the number of points per bar. For example, a Time/Price Gann Line of 1 x 2 has a time unit of 1 bar and a price unit of 2. Therefore, for every bar, the Gann line increases in price two points. For an 8 x 1 Time/Price Gann Line, the time unit is 8 bars and the price unit is 1 point. Therefore, for every 8 bars, the Gann Line increases in price 1 point.
- Direction of the Gann Fan - The direction of a Gann Fan should depend on current trend. For example, when evaluating an uptrend, a Gann Fan should be drawn upward to the right, starting at a market low. When evaluating a downtrend, the Gann Fan should be drawn down from the right, starting at a market high.
- Points per bar - The price points per bar applies a multiplier to the price value used to calculate the Time/Price Gann Line. For example, an 8 x 1 Time/Price Gann Line with a price points per bar value of .125 draws a Gann Line at a slope that increases 1 x .125 on the price axis (y-axis) for every 8 bars (x-axis). The price per points value multiplied by the price value determines how much the Time/Price Gann Line increases for each bar.
- Activate a Chart Analysis window containing a Gann Fan object.
- Right-click on the Gann Fan object and select Edit 'Gann Fan' from the menu. The Customize Gann Fan dialog is displayed.
- Click the Settings tab.
- Under Time/Price Gann Lines, a check mark indicates that the line segment will be displayed. Remove the check mark to hide the line.
- Under Line Color, Line Style, and Line Weight use the drop-down list to change the setting for each segment.
- Under Transparency, enter a value in the % box to change the transparency of each segment where 0% is solid and 100% is invisible.
- Under Direction, select which direction you want the lines to extend: Up left, Up right, Down left, or Down right.
- Enter a price value representing the [ ] points per bar box.
- Select the Set as Default check box to apply these settings as the default for all future Gann Fans.
- Click OK.
Related Topics
Customizing the Alerts of a Drawing Object
Customizing the Labels of a Drawing Object