Fibonacci Speed/Resistance Arcs Drawing Object
Speed/Resistance Arcs are analytical drawing tools used to determine direction and speed of a trend reversal as well as support and resistance levels for a particular market. The Speed/Resistance Arc consists of an underlying trendline from which Speed/Resistance Arcs are drawn. These arcs are drawn based on distance percentages between the beginning and end of the underlying trendline. The most common speed line percentages used by analysts are one-third and two-thirds. However, many analysts use common percent retracement numbers of 33%, 50%, and 66% as well as percentages based on the Fibonacci number series.
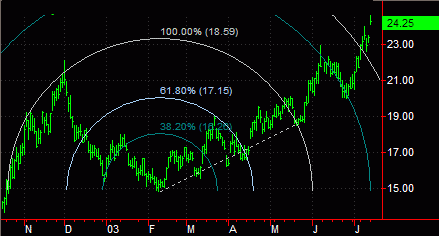
Speed/Resistance Arcs use arched lines to represent speed resistance lines combining the underlying trendline with percent retracement analysis. The main difference between Speed/Resistance Arcs and percentage retracement analysis is that Speed/Resistance Arcs not only detect trend corrections but also measure the speed of a trend (the rate at which a trendline ascends or descends).
As with percent retracement, the Speed/Resistance Arc identifies the level a trend correction may rise or fall. In an uptrend, a downside correction usually stops at the higher arc and, if not, prices will probably drop to the lower arc. If that arc is broken, prices will most likely continue down to the beginning of the prior trend (or underlying trend). In a downtrend, the breaking of a lower arc indicates a possible rise or rally to the higher arc. If a breakout occurs above that arc, the rally may continue to the top of the prior trend (or underlying trendline).
Similar to Gann Fan lines, Speed/Resistance Arcs can indicate support and resistance levels. In general, a market's price usually remains above the higher arc in an uptrend. If this line is penetrated, prices generally fall to the lower arc, which, in many cases, becomes the support level. If prices break below the higher arc, fall to the lower arc (an uptrend correction), and then begin to rise, that lower arc becomes the resistance level.
You can also use the shortcut menu for a selected object component (identified with small squares) to change the drawing properties such as Color, Style, Weight, and any object specific settings.
Drawing a Fibonacci Speed/Resistance Arc Object
Drawing objects are applied to a chart to assist with data analysis. See About Drawing Objects for more details.
- Activate a Chart Analysis window.
- Use the Drawing > Fibonacci Speed/Resistance Arcs menu sequence. Your pointer will change to the shape of Speed/Resistance Arc object.
- Click where you want the center of the Speed/Resistance Arc to be anchored.
- Move your pointer up, down, left, or right to position the Arc, then click again to add.
- Optional. Use the Drawing > Snap Mode menu sequence to "snap" the underlying trendline to the open, high, low, or closing price of the first and last bars the trendline intersects. For more information, see Snap Mode.
In an up trend, the underlying trendline of a Speed/Resistance Arc should be drawn from a price trough (low) up to the next highest high or an intermediate high. In a downtrend, it should be drawn from the beginning of the downtrend to the next low or intermediate low. For more information, see Customize the Properties of a Speed/Resistance Arc.
Moving a Fibonacci Speed/Resistance Arc Object
After a Speed/Resistance Arc is applied to a chart, you can reposition the drawing object at any time.
- Activate a Chart Analysis window containing a Fibonacci Speed/Resistance Arc object.
- Select the Speed/Resistance Arc (a small square at each end of the underlying trendline used to create the arcs confirms the drawing object is selected).
- Drag either end of the trendline to lengthen, shorten, or change the slope of the underlying trendline and the arcs based on this trendline. Dragging any portion of the Speed/Resistance Arc, with the exception of the squares at each end of the underlying trendline, allows you to move the Speed/Resistance Arc horizontally and vertically without changing the underlying trendline's attributes. This allows you to reposition the Speed/Resistance Arc without changing the slope of the underlying trendline or the arcs based on this trendline.
- Optional. Use the Drawing > Snap Mode menu sequence to "snap" the underlying trendline to the open, high, low, or closing price of the first and last bars the trendline intersects.
Customizing the Fibonacci Speed/Resistance Arc Settings
Speed/Resistance Arcs are based on an underlying trendline. Each arc intersects the trendline at a specified distance between the beginning and end of the trendline. You can modify Speed/Resistance Arcs by specifying their percentage, number of arcs drawn, time/price relationship as well as other properties.
- Activate a Chart Analysis window containing a Fibonacci Speed/Resistance Arc object.
- Right-click on a Fibonacci Speed/Resistance Arc line. Select Edit 'Fibonacci Speed/Resistance Arcs' from the shortcut menu.
- Click the Settings tab.
- The Speed/Resistance Arc is based on an underlying trendline. Select the Trendline check box to show this underlying trendline. Clearing this check box displays the trendline on your chart.
- Under Percentage, select a check box and enter an appropriate value in the corresponding box (for example, .5 equals, 50%, .6 equals 60%, .7 equals 70%, and so on). This percentage determines at what point an arc intersects the underlying trendline. For example, an arc drawn at 40% (.40) intersects the underlying trendline at 40% of its length (when the Divide Time/Price separately check box is cleared). This same arc drawn when the Divide Time/Price separately check box selected intersects the underlying trendline at 40% of its length (x-axis) as well as 40% of its height (y-axis).
When entering a percentage, the corresponding check box must be selected for that arc to be drawn.
- In the drop-down lists, select a Line Color, Line Style, and Line Weight for each segment.
- Selecting the Use the following color, style and weight for all lines check box will allow the matching properties to be used for all lines. The individual line properties will become unavailable (grayed out).
- Select Display Full Arc check box to extend your arc to the shape of an ellipse or circle (depending on your Divide Time/Price separately setting).
- Select the Divide Time/Price Separately check box to construct an arc where time and price are independent of one another. For example, a horizontal underlying trendline (a slope of zero) is used to evaluate markets where a long period of time is needed for a small price movement. If you select the Show Full Arc check box, the ellipse's horizontal axis is larger than its vertical axis. A vertical trendline is used to evaluate markets where a short period of time is needed for significant price movement. In this case, this ellipse's vertical axis is larger than its horizontal axis. Clear the Divide Time/Price separately check box to construct an arc whose radius (the length from the origin of the underlying trendline to point where the arc intersects the trendline) is constant.
- Select the Set as Default check box to use these property settings as the default for future Speed/Resistance Arcs.
- Click OK.
You can also use the shortcut menu for a selected object to change available settings.
Related Topics
Customizing the Labels of a Drawing Object