Fibonacci Cycles Drawing Object
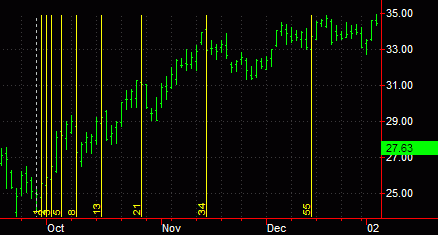
Fibonacci Cycles are analytical drawing tools that consist of a series of vertical lines representing Fibonacci Time Zones with the lines spaced at Fibonacci intervals of 1, 2, 3, 5, 8, 13, 34, 55, etc from a previous high or low. Fibonacci Cycles are used to look at significant changes in price in the proximity of the vertical lines. It is believed that the market frequently experiences a reversal in trend near these Fibonacci intervals that start from previous highs or lows.
You can also use the shortcut menu for a selected object component (identified with small squares) to change the drawing properties such as Color, Style, Weight, and any object specific settings.
Drawing Fibonacci Cycles
Drawing objects are applied to a chart to assist with data analysis. See About Drawing Objects for more details.
- Activate a Chart Analysis window.
- Use the Drawing > Fibonacci Cycles menu sequence. Your pointer will change to the shape of Fibonacci Fixed-based Time Lines.
- Click where you want to add the Fixed-based Time Lines and drag your pointer to the left or right to position the drawing object.
- Click where you want the Fixed-based Time Lines to begin.
- Move the pointer up, down, left, or right to position the Fixed-based Time Lines, then click again to add.
Moving a Fibonacci Cycles
After a Fibonacci Cycles is applied to a chart, you can reposition the drawing object at any time to evaluate another group of bars.
- To move a Fibonacci Cycles, select the Fibonacci Fixed-based Time Lines (small squares in the middle of each Fibonacci line confirms the drawing object is selected).
- Drag horizontally to reposition.
Related Topics
Customizing the Alerts of a Drawing Object
Customizing the Labels of a Drawing Object
Customizing the Style of a Drawing Object